Canadian Economy
Canadian Economy
Canadian economy shrinks to start 2018.
The Canadian economy opened the year on a down note as a sharp decline in energy and mining activity drove overall GDP lower in January. All told, value-added output across the country fell by just over 0.1 per cent compared to December – equivalent to an annualized decrease of about 1.5 per cent.
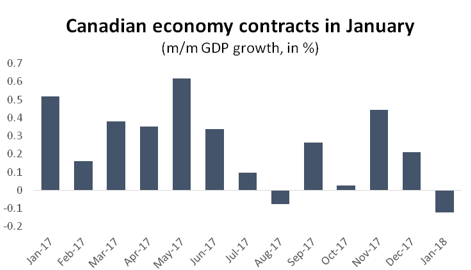
Graph showing Canadian economy contracts in January. Economic Analysis: GDP, January 2018.
January’s decline confirms that the economy is well into a slower-growth phase compared to the first half of 2017. Last winter and spring, the economy roared out of the gate, posting annualized growth of over four per cent in every month except February. In four of the last seven months, however, growth has been stuck in the range of 1.0 per cent or less.
This trend is likely to continue throughout the first half of 2018. The tremendous run-up in GDP that began 12 months ago means that the Canadian economy will have to grow at least as quickly just to maintain at its current year-over-year growth rate (in the range of 2.7 per cent) . That is highly unlikely to happen given that most of last year’s growth was the result of a one-time, price-led recovery in energy and consumer spending.
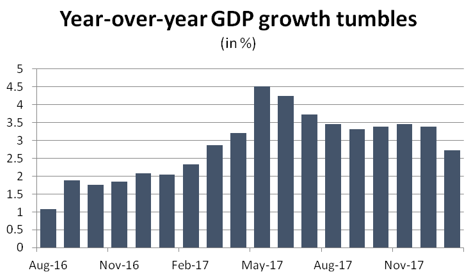
Graph showing the year-over-year GDP growth tumbles. Economic Analysis: GDP, January 2018.
As noted above, most of January’s decline can be pinned on Canada’s extractive industries. GDP in energy and mining fell by 2.7 per cent compared to December, with most of those losses coming from a sharp drop in oil sands activity. In fact, outside of energy and mining, the Canadian economy eked out a modest 0.1 per cent gain to start the year.
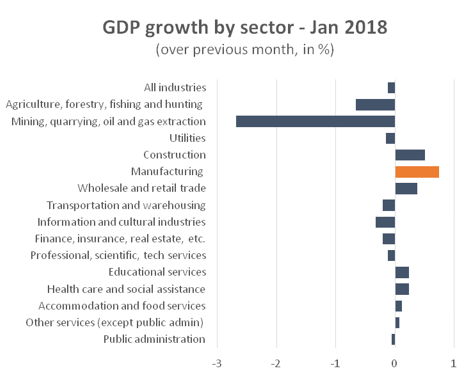
Graph showcasing GDP growth by sector. Economic Analysis: GDP, January 2018.
This is not to say, however, that the non-extractive economy performed well in January. Of the fifteen major industrial categories, eight were lower to start the year, with the sharpest losses coming in agriculture and forestry (down 0.7 per cent).
Of the seven industry grouping to see positive GDP growth in January, only three posted notable gains. Value-added activity in wholesale and retail trade was up 0.4 per cent, and construction activity was 0.5 per cent higher. By far the strongest performance in January, however, was in the manufacturing sector, where GDP was up 0.7 per cent compared to December.
The increase in manufacturing GDP represented a positive development in what has been a volatile few months for the sector. In November, manufacturing GDP spiked by (a revised) 1.8 per cent in a single month, buoyed by the auto sector returning to normal production levels. In December, manufacturers gave back some of those gains as value-added output fell by (a revised) 0.4 per cent. January saw GDP growth swing back to the positive side of the ledger with a strong 0.7 per cent increase. That was enough to push real monthly GDP in manufacturing to a 10-year high.
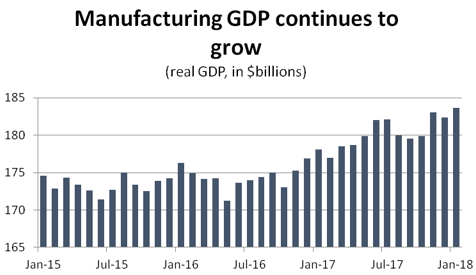
Graph showcasing that manufacturing GDP continues to grow. Economic Analysis: GDP, January 2018.
Although overall manufacturing GDP was strong in January, results within the sector were mixed. Leading the way on the positive side was a surge in chemicals production, where GDP was up 4.3 per cent on the strength of a recovery in pharmaceuticals output. There were also solid gains in fabricated metals industries (2.6 per cent) and food processing (1.2 per cent).
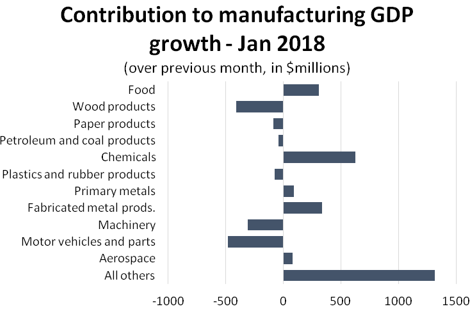
Chart showing contribution to manufacturing GDP growth for January. Economic Analysis: GDP, January 2018.
Interestingly, a significant share of January’s gains came from outside Canada’s eleven major manufacturing sub-sectors. Value-added output was significantly higher for producers of beverages, printed goods, computers and electronics, and miscellaneous products (mostly medical equipment and certain consumer goods).
Those gains were offset in part by losses in three main industries: motor vehicles and parts; machinery; and wood products. On a percentage basis, the steepest decline was in wood products where GDP fell by 4.0 per cent in January. For its part, auto sector GDP fell by 2.7 per cent – its third consecutive month of declining value-added output. Finally, GDP in machinery production fell by 1.9 per cent as that industry has plateaued after a 12-month surge in activity that began in mid-2016.