Canadian Economy
Canadian Economy
Energy and trade fuel strong economic growth in May.
After a flat performance in April, the Canadian economy surged ahead in May, posting its strongest monthly growth since July 2016. Driven by the energy sector and wholesale/retail trade activity, GDP in May was up by 0.51 per cent compared to April – an annualized increase of nearly 6.4 per cent.
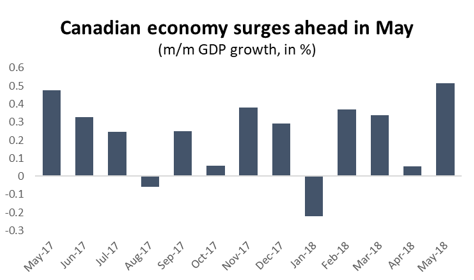
Graph showing that the Canadian economy surged ahead in May. Economic Analysis: GDP, May 2018.
That spike in economic activity had little impact on year-over-year growth, however. The first half of 2017 was also a period of strong growth in the Canadian economy. May’s GDP growth of 0.51 per cent was only slightly better than the 0.48 per cent surge 12 months earlier. As a result, year-over-year GDP growth was more or less unchanged in May, rising to 2.7 per cent from 2.6 per cent in April.
There is no doubt that May’s GDP growth was an unambiguous good-news story for the Canadian economy. Trouble looms on the horizon, however, in the form of the impact of ongoing trade disputes with the US. May was the last month before the US imposed tariffs on Canadian steel and aluminum producers. Canada’s retaliatory tariffs went into effect on July 1st. Our first glimpse at the impact of the former will come in about 30 days.
Turning back to happier matters, May’s GDP gains were widely shared, with positive growth in 14 of the 15 major industrial groupings. Only the utilities sector saw lower GDP in May, giving back the gains from a spike in output the previous month.
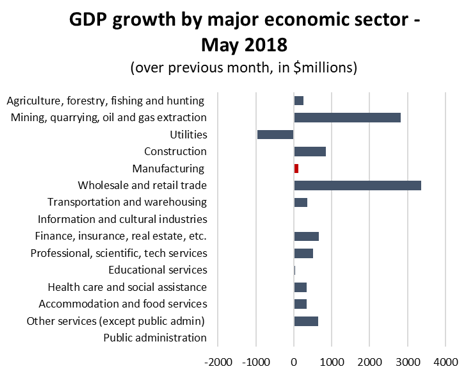
Graph showing GDP growth by major economic sector. Economic Analysis: GDP, May 2018.
As noted above, the biggest increases were in the energy sector and in trade. Specifically, oil sands activity surged in May, rising by 5.3 per cent compared to April. That increase not only drove oil sands GDP to a new all-time monthly high, but it singlehandedly accounted for about 43 per cent of all economic gains across Canada than month. For its part, retail trade activity was up 2.0 per cent, recovering from a poor month in April, while wholesale trade GDP was 1.8 per cent higher.
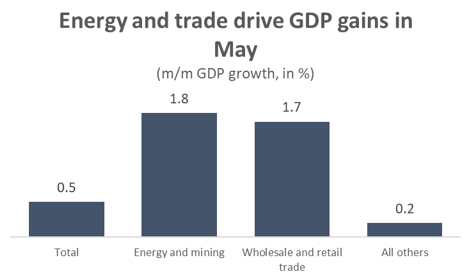
Graph showing that energy and trade drive GDP gains in May. Economic Analysis: GDP, May 2018.
For its part, the manufacturing sector posted modest gains in May, with GDP rising by 0.1 per cent compared to April. Though small, that growth builds on a relatively strong showing from the previous month and is contributing to solid manufacturing GDP growth so far this year. Through five months, manufacturing GDP in 2018 is tracking a healthy 2.8 per cent higher compared to the same period last year.
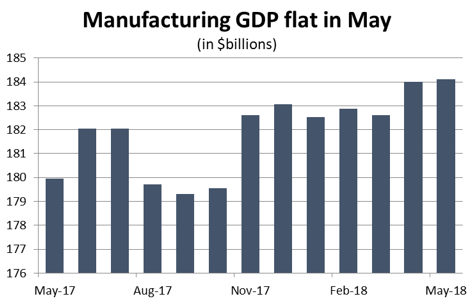
Graph showing that manufacturing GDP was flat in May. Economic Analysis: GDP, May 2018.
With only small overall gains, results within the manufacturing sector were unsurprisingly mixed in May. Five of Canada’s 11 leading manufacturing sub-sectors posted higher GDP numbers, while GDP was lower in the other six. The chemicals sub-sector led the way on the positive side, with growth of about 4.5 per cent compared to April. Machinery value-added activity was also notably higher, rising by 2.5 per cent.
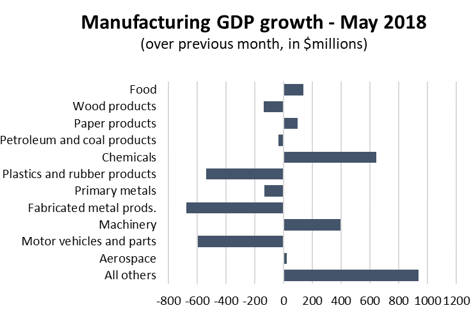
Graph showing the manufacturing growth in May. Economic Analysis: GDP, May 2018.
Those increases were helped along by impressive gains in several of Canada’s smaller manufacturing industries. GDP was up significantly in all of the following industries in May: Computer and electronics, electrical equipment and components, beverages and tobacco, printing, and furniture-related manufacturing.
On the negative side, May was a forgettable month for the auto sector, where GDP fell by 3.3 per cent, driving value-added output down to its lowest level since October. There were even larger declines in two other industries: GDP in both fabricated metals, as well as plastics and rubber production, were each down 4.8 per cent.