Labour Market Trends
Labour Market Trends
Modest overall job gains in March despite losses in manufacturing.
1- Canadian Labour market
After posting steep losses to start the year, the Canadian labour market continued to chip away at that decline, with modest job gains in February and again in March. Last month, the Canadian economy added 32,300 net new jobs – equivalent to an increase of about 0.2 per cent. Although Canada has added 47,700 jobs in the past two months, there were still more than 40,000 fewer Canadians employed in March than there were at the end of 2017.
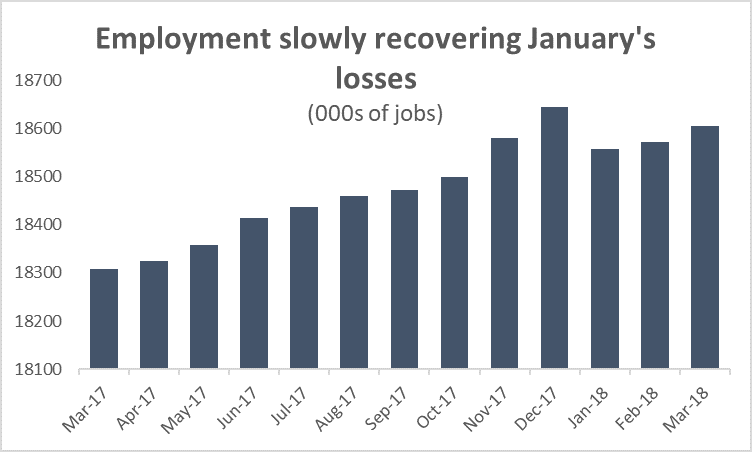
Graph showing that employment is slowly recovering from January's losses. Labour Force Survey Analysis, March 2018.
Job growth in March was only just enough to keep pace with the increase in the size of the labour force. As a result, the monthly unemployment rate held steady at 5.8 per cent. It bears repeating that even though the unemployment rate is sitting at historic lows, it is not because of robust employment growth; rather, it is the result of a steady decline in labour force participation. Through the first quarter of 2018, the participation rate – the share of working-age Canadians employed or actively looking for work – has averaged 65.5 per cent – its lowest quarterly level since 1999. In other words, Canadians only count as unemployed if they report that they are actively seeking a job. As fewer people even try looking for work, fewer are counted amongst the ranks of the unemployed.
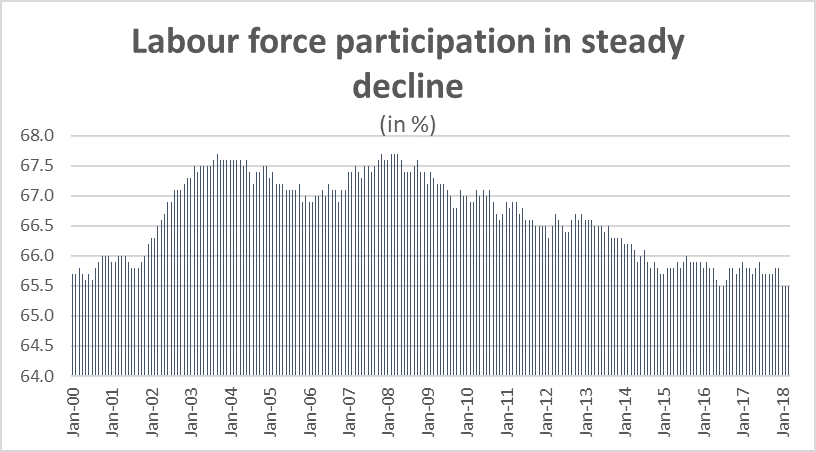
Graph showing that labour force participation in steady decline. Labour Force Survey Analysis, March 2018.
Although overall job growth was modest, the good news is that the increase in March was the result of solid full-time job creation. There were 68,300 net new full-time jobs created last month, offsetting a decline of about 35,900 part-time positions.
Job growth was decidedly mixed across Canada in March, with gains in Central Canada and on the prairies, and losses in Atlantic Canada and BC. In terms of absolute employment gains, Quebec was the national leader, creating 16,000 net new positions – an increase of about 0.4 per cent compared to February. Ontario and Alberta also added 10,600 and 8,300 jobs, respectively. On a percentage basis, however, Saskatchewan led the way, with a solid 0.7 increase.
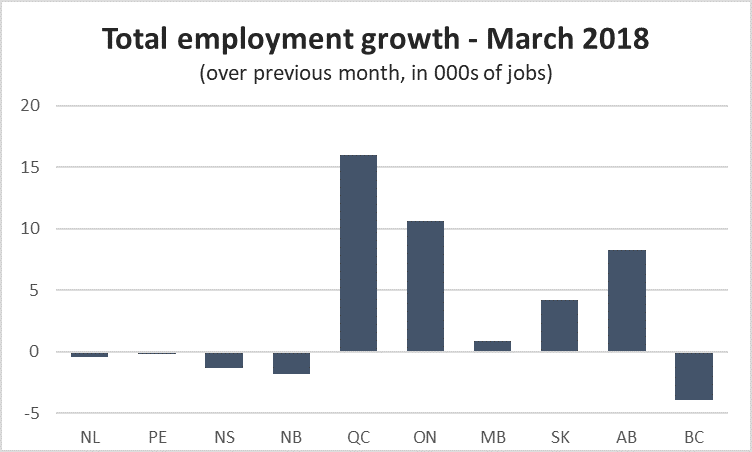
Graph showing total employment growth in MarchLabour Force Survey Analysis, March 2018.
While there were cross-the-board job losses in Atlantic Canada and in BC, the good news is that, in all cases, the declines were relatively small. The only concerning note is BC – Canada’s job growth leader for the past two years – has now seen three consecutive months of decline.
Results were also mixed at the industry level. There were solid overall gains in the goods sector (0.6 per cent growth compared to February), fuelled by a surge in construction employment (18,300 new jobs), and strong gains in agriculture (8,100 new jobs).
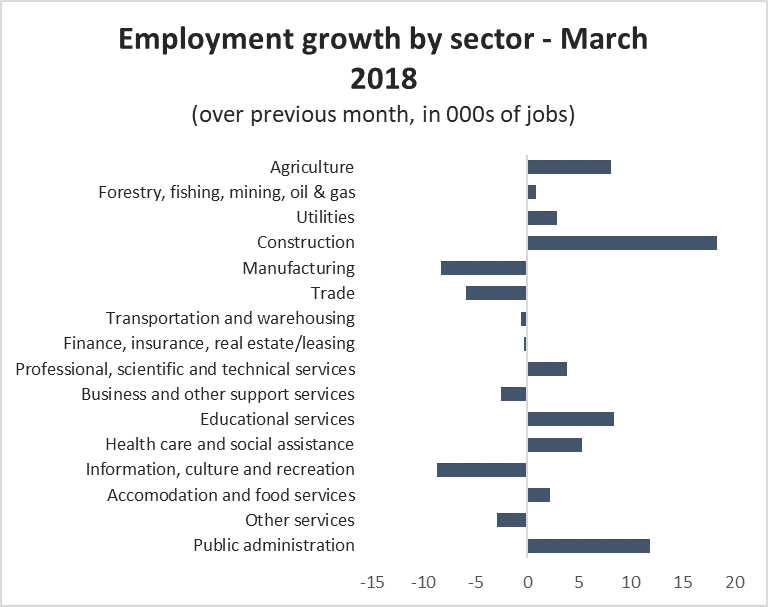
Graph showing employment growth by sector, Labour Force Survey Analysis, March 2018.
On the services side, overall growth was minimal (0.1 per cent). There was a spike in the number of public sector workers (11,900 jobs, or 1.2 per cent), as well as increases in education and health care. Those gains were countered by job losses in information, culture and recreation industries (8,700 jobs), as well as in wholesale and retail trade (5,900 positions).
2 – Manufacturing Sector Labour Market
March was a down month for manufacturing employment as the sector continues to slowly give back the gains it made at the end of 2017. Employment hit a five-and-a-half-year high in January (1.77 million jobs), but the sector lost 16,500 jobs in February and then another 8,300 positions last month.
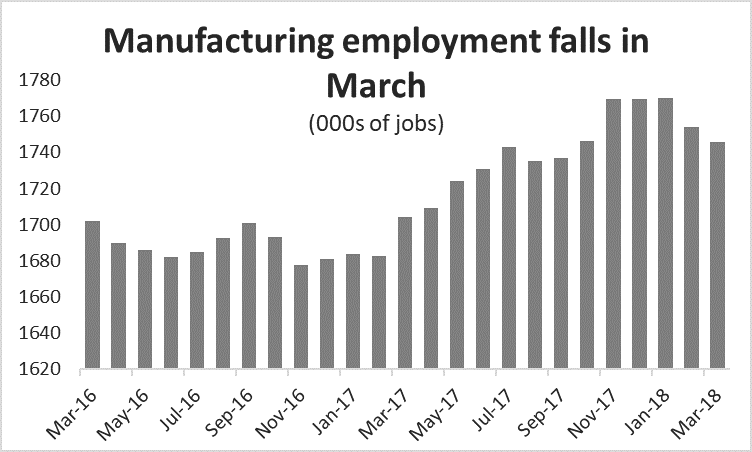
Graph showing that manufacturing employment falls in March.Labour Force Survey Analysis, March 2018.
While employment is down in the last two months, it remains well above levels seen at the same time last year. Through three months, manufacturing employment is tracking 3.9 per cent higher compared to the first quarter of 2017.
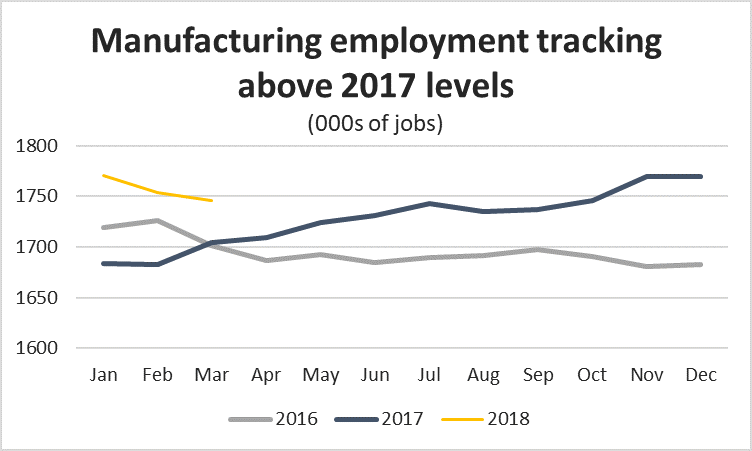
Graph showing that manufacturing employment tracking above 2017 levels. Labour Force Survey Analysis, March 2018.
Although Quebec was Canada’s overall job growth leader in March, it also posted the steepest losses in the manufacturing sector. Manufacturing employment in Quebec fell by 1.7 per cent (8,700 jobs) compared to February, marking the fourth consecutive month of declines. Quebec has lost 18,800 manufacturing jobs since November. BC and Manitoba also posted losses of 1,200 and 900 jobs, respectively; and employment was down across the Maritime provinces.
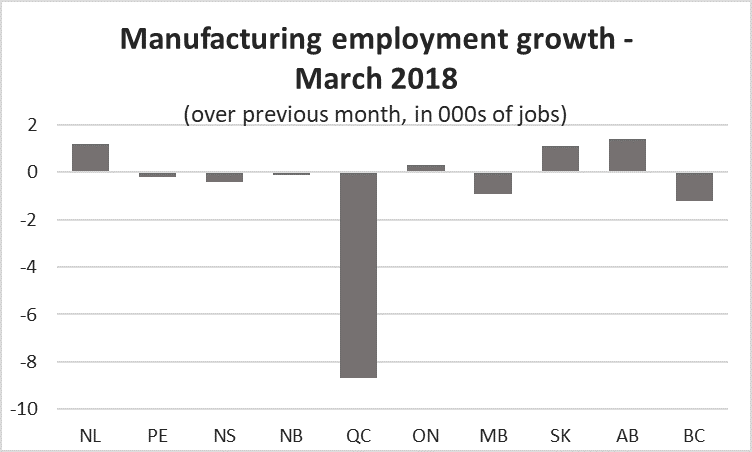
Graph showing manufacturing employment growth in March. Labour Force Survey Analysis, March 2018.
On the positive side, Saskatchewan and Alberta both recorded notable increases in manufacturing employment. There were 1,100 new jobs added in Saskatchewan, driving provincial manufacturing employment to its highest level since June 2014. Meanwhile in neighbouring Alberta, manufacturers continue the slow process of climbing out of the hole created by the collapse in oil prices in 2014 and 2015. Manufacturers in Alberta have added 23,400 jobs since the beginning of 2017, but there are still about 20,000 fewer manufacturing jobs in the province compared to the peak in August 2014.