International Trade
International Trade
Imports fall by more than exports, creating Canada’s first trade surplus in 20 months.
August was a poor month on the international trade front for Canada as both imports and exports were markedly lower compared to July. However, the drop in imports was substantially larger than the decline in exports. As a result, Canada posted its first monthly trade surplus since December 2016.
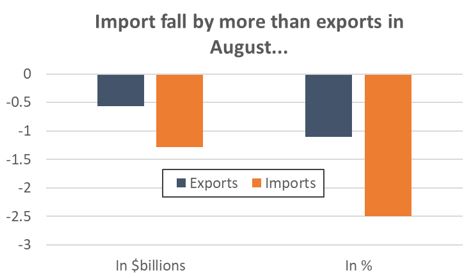
Graph showing that imports fall by more than exports in August. Merchandise Trade Analysis, August 2018.
Beginning with exports, Canadian sales abroad fell by 1.1 per cent in August – a decline of about $564 million compared to July. That drop wiped out two months’ worth of export gains, bringing the value of monthly exports down to $50.5 billion from (a revised) $51.1 billion in July. Meanwhile, imports were down by 2.5 per cent ($1.3 billion) compared to July, dropping to $50.0 billion – their lowest level since February. That combination led to a $520 million trade surplus for the month.
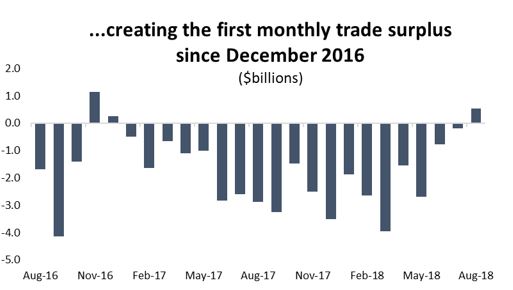
Graph showing the first monthly trade surplus since December 2016. Merchandise Trade Analysis, August 2018.
In spite of August’s decline, overall exports remain well above 2017 levels. Exports are more than 15 per cent higher than they were 12 months earlier, and total year-to-date exports are 5.8 per cent higher than they were through the same period in 2017.
While prices also fell, most of the decline in trade in August was the result of lower sales volumes. On the export side, the volume of deliveries was down by 0.7 per cent, while prices were only slightly lower. As for imports, the decline in the volume of foreign goods purchased in Canada was considerable; import volumes were down 1.5 per cent, despite the fact that average prices for those goods fell by about 0.7 per cent.
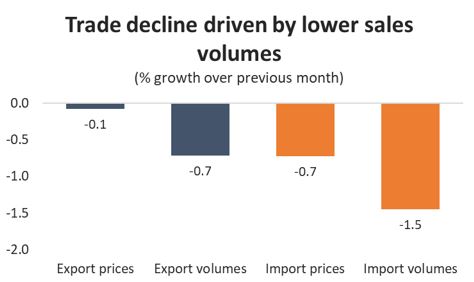
Graph showing that the trade decline is driven by lower sales volumes. Merchandise Trade Analysis, August 2018.
In terms of export products, there were more winners than losers in August. Six of the eleven major product categories saw deliveries rise that month. Unfortunately, those gains were wiped out by significant losses in two key areas: first, motor vehicles and parts exports fell by 6.2 per cent in August ($492 million), effectively wiping out two months of steady gains; second, export of metals and non-metallic mineral products were $352 million lower compared to July – a figure that coincidentally also works out to a 6.2 per cent decline.
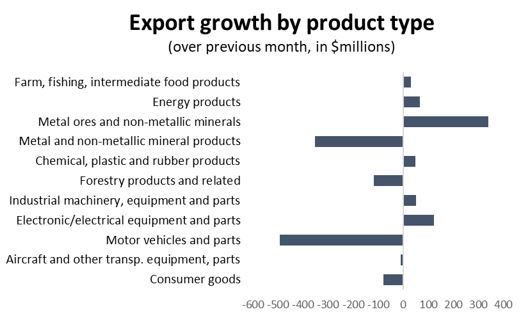
Graph showing export growth by product type. Merchandise Trade Analysis, August 2018.
While it would be natural to assume that the US-imposed tariffs on aluminum and steel products drove the decline in metals exports, that is in fact not the case. Iron and steel exports were higher in August and while aluminum exports did fall, the drop was relatively modest. Rather, the bulk of the decline in metal products exports was the result of lower shipments of gold and other precious metals, with a smaller, but still significant, drop in exports of nickel.
On the positive side, there was a notable increase in exports of raw metals and minerals in August. Copper and diamonds helped drive exports of those products up by more than 20 per cent ($341 million) compared to July.
The decline in exports in August was largely the result of lower sales in two specific countries – the United States and the United Kingdom. Driven by lower motor vehicles and parts shipments, US-bound exports were down $446 million compared to July – a decline of 1.2 per cent. However, it is worth noting that the decline in southbound exports represents only a modest setback after several months of solid growth. Meanwhile, exports to the UK plunged by more than 33 per cent ($583 million) on the back of lower gold exports. The good news is that that decline represents a return to more typical export levels after an unusual spike in deliveries to the UK in July.
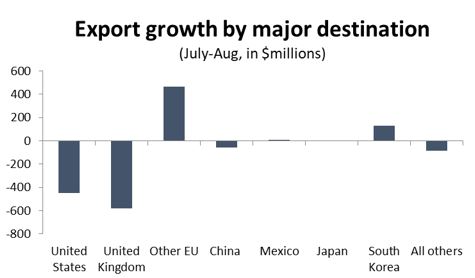
Graph showing export growth by major destination. Merchandise Trade Analysis, August 2018.
On the positive side, Canadian exports to other EU destinations was up by more than 18 per cent in August, led by strong sales in the German, French, Spanish, Dutch and Italian markets.
Looking at imports into Canada, the decline in August was driven by three specific product categories – motor vehicles and parts; aerospace products; and consumer goods. The largest drop was in the aerospace sector, where imports fell by nearly 28 per cent ($518 million). That decline continues a trend that has seen aerospace imports into Canada drop by more than 45 per cent since May. For its part, motor vehicles and parts imports were 3.8 per cent lower ($360 million), while widespread losses drove consumer goods imports down by 3.7 per cent ($404 million).
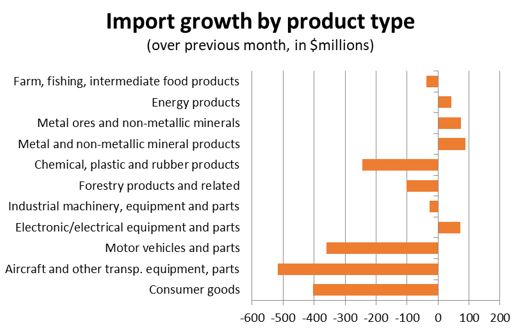
Graph showing import growth by product type. Merchandise Trade Analysis, August 2018.
On a country-by-country basis, the decline in imports was relatively widespread as Canadians bought fewer goods from all around the world in August. Imports from the US were down by $442 million. Imports from the EU were $371 million lower, and those from China were down by $204 million. Germany and Switzerland were among the few major trading partners to see their sales into Canada rise in August.
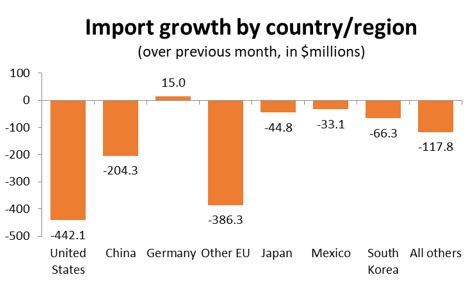
Graph showing import growth by country/region. Merchandise Trade Analysis, August 2018.