Canadian Economy
Canadian Economy
Energy sector fuels solid GDP gains in March, helping to salvage first quarter results.
The Canadian economy posted solid gains in March, although not enough to rescue what was a relatively weak first quarter for national GDP growth.
Beginning with the monthly numbers, national GDP grew by a healthy 0.3 per cent in March, equivalent to an annualized increase of about 3.6 per cent. That growth builds on the momentum generated by an even stronger February, when the economy expanded at an annualized rate of about 5.0 per cent.
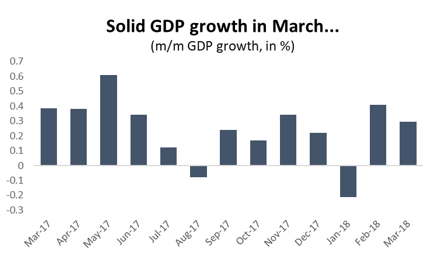
Graph showing solid GDP growth in March. Economic Analysis: GDP, March 2018.
However, those gains were deflated by an economic contraction in January. As a result, overall (annualized) growth for the first quarter of 2018 came in at an estimated 1.3 per cent. That represents the slowest quarterly growth rate for the Canadian economy since Q2 2016, when wildfires ravaged northern Alberta and shut down much of the province’s oil and gas production.
That 1.3 per cent growth in Q1 also confirms the end of a brief surge in the Canadian economy over a one-year period through the second half of 2016 and the first half of 2017. GDP growth over that period was about 3.8 per cent. Since then, Canada has seen three consecutive quarters of growth under two per cent.
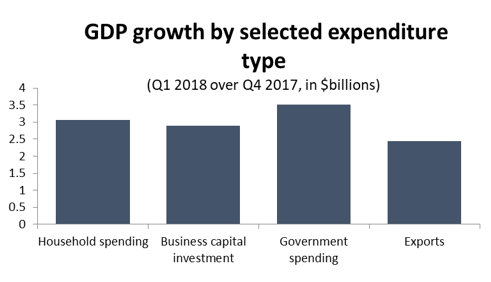
Graph showing GDP growth by selected expenditure type. Economic Analysis: GDP, March 2018.
Although overall growth in Q1 was relatively modest, the good news is that gains were remarkably evenly distributed across major expenditure types. Not only were household spending, business investment, government spending and exports all higher in Q1, but they all made similar contributions to overall GDP growth.
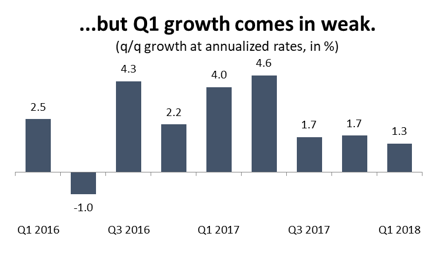
Graph showing Q1 growth comes in weak. Economic Analysis: GDP, March 2018.
The bad news, however, is that Q1 figures confirm a massive slowdown in consumer activity in Canada. Household spending had been the main bright spot in the Canadian economy for several years as exports and business investment languished. However, a combination of slower job growth, higher interest rates and tighter mortgage lending rules have caused household expenditures to slow dramatically over the last three quarters. While a climbdown in household spending was long overdue, it could portend weaker GDP growth ahead unless business investment and exports do a better job of picking up the slack.
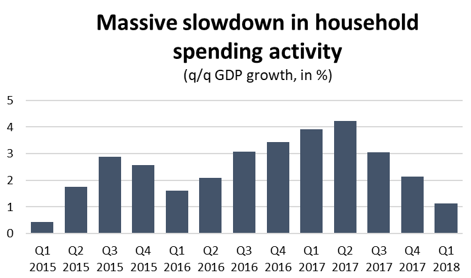
Graph showing a massive slowdown in household spending activity. Economic Analysis: GDP, March 2018.
Turning back to the monthly GDP numbers, the gains in March were largely driven by a surge in energy sector activity. Buoyed by higher crude oil prices, GDP in the energy sector jumped by 1.8 per cent compared to February, accounting for almost 60 per cent of all economic growth across Canada that month. There was also solid growth in wholesale and retail trade (0.7 per cent), as well as transportation and warehousing (0.8 per cent).
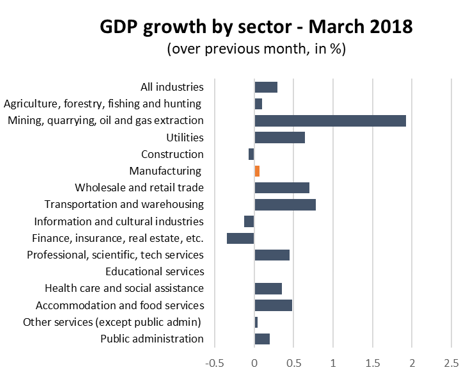
Graph showing GDP growth by sector. Economic Analysis: GDP, March 2018.
Most other major economic sectors posted small gains in March, with the notable exception of finance and insurance. GDP in Canada’s largest services sector industry fell sharply in March, dropping by 1.2 per cent compared to February.
Looking specifically at the manufacturing sector, March was a somewhat disappointing month. Not only was GDP essentially unchanged, but there was a substantial revision to February’s growth numbers as well. Initial estimates had pegged February’s GDP growth in manufacturing at about 1.0 per cent. However, revised estimated cut that rate almost in half.
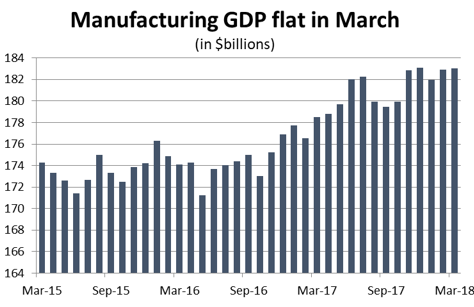
Graphs showing a flat manufacturing growth in March. Economic Analysis: GDP, March 2018.
Within the sector, results were mixed. Of the eleven major manufacturing sub-sectors in Canada, five were higher, four were lower, and two were essentially unchanged. Generally speaking, March was a good month for non-durable goods production, where GDP grew in line with the all-industry average. However, it was a poor month on the durable goods side, where GDP fell by 0.1 per cent compared to February.
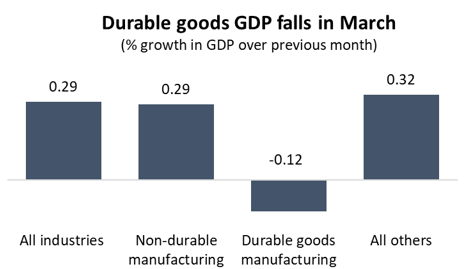
Graph showing the fall in the GDP for durable goods in March. Economic Analysis: GDP, March 2018.
Looking at specific industries, Canadian plastics and rubber producers saw GDP in their industries spike by 7.0 per cent compared to February, ending four consecutive months of decline. Chemicals producers also saw GDP increase by 2.9 per cent in March, gaining back most of the losses in the previous two months. There were also solid gains in paper production and primary metals.
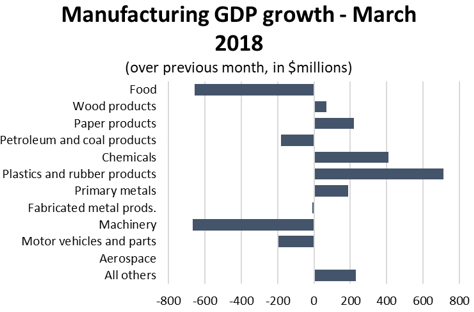
Graph showing the manufacturing GDP growth for March. Economic Analysis: GDP, March 2018.
On the negative side, food processing and petroleum refining bucked the otherwise positive showing on the non-durable goods side. GDP in food production dropped by 2.5 per cent in March to reach its lowest level since September, while a refinery shutdown in BC contributed to a similar decline in that industry. As for durable goods, there were steep losses in value-added machinery output, which fell by 4.1 per cent compared to February. Meanwhile, GDP in the auto sector fell by about 1.1 per cent.