International Trade
International Trade
Strong export growth and lower imports cut Canada’s trade deficit in April.
Canadian exporters built on a strong March with another month of solid gains in April. After rising by 3.6 per cent the previous month, exports were up another 1.6 per cent in April to reach $48.6 billion – eclipsing the previous all-time monthly high set in May 2017.
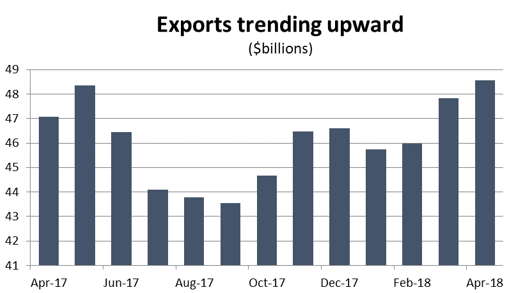
Graph showing that exports are trending upwards. Merchandise Trade Analysis, April 2018.
Meanwhile, a sharp decline in purchases of foreign cars and consumer goods drove imports down by 2.5 per cent to reach $50.5 billion. That decline erased about half of the gains from a spike in imports in March and caused Canada’s monthly trade deficit to fall from about $3.9 billion in March to $1.9 billion in April – its lowest level since October.
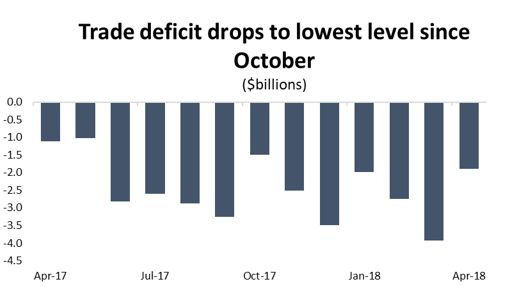
Graph showing that trade deficit drops to lowest level since October. Merchandise Trade Analysis, April 2018.
Solid growth over the last two months may be signalling the end of a prolonged rut for Canadian exports. Year-over-year exports had been flat since last July, but thanks to recent strength, are now tracking about 3.1 per cent higher than they were 12 months ago. While 3.1 per cent is still not an especially strong growth rate for exports, it is at least heading in the right direction.
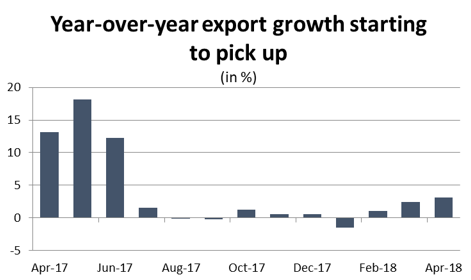
Graph showing that export growth is starting to pick up. Merchandise Trade Analysis, April 2018.
The issue is whether that trend will continue. While momentum is on exporters’ side, recent US trade actions are casting a shadow on growth prospects over the summer. It remains to be seen how tariffs on aluminum and steel will impact exports and, more to the point, whether these measures prove to be temporary or the beginning of a larger trade dispute with broader collateral damage to Canadian exporters and the economy as a whole.
For the second month in a row, export gains were primarily driven by higher sales volumes. Export volumes rose 1.2 per cent in April, building on a 3.4 per cent increase in March. Those gains were bolstered by a modest increase in prices as well – export prices were up 0.4 per cent in April after rising 1.4 per cent the previous month. On the import side, the decline was entirely driven by lower sales volumes. Import volumes were down 2.4 per cent compared to March, while average prices were essentially flat.
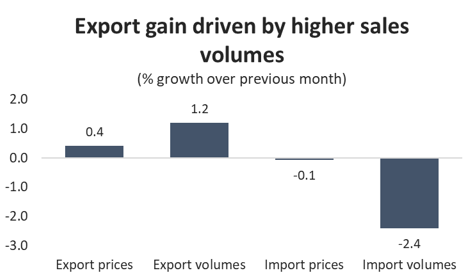
Chart showing that export gain is driven by higher sales volumes. Merchandise Trade Analysis, April 2018.
In terms of export products, April’s results were mixed with six of the broad product categories posting gains, offsetting losses in the other five. Leading the way on the positive side was a surge in exports of metal and non-metallic mineral products (9.1 per cent), erasing the impact of steep declines over the previous two months. Consumer goods exports were also up for the third month in a row (by 5.4 per cent) and are now at their highest level since December 2016. April also saw solid gains in exports of energy and forest products.
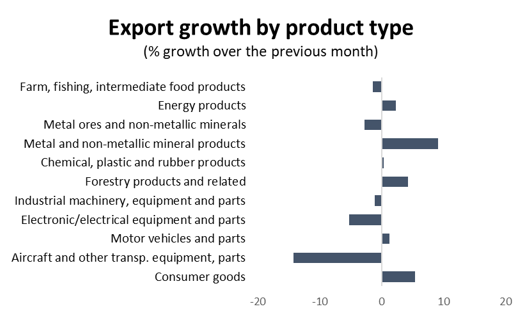
Graph showing export growth by product type. Merchandise Trade Analysis, April 2018.
Dampening those gains was a steep decline in aerospace exports, which were down about 14.2 per cent. However, that drop was not the result of weakness in the sector, but the impact of a one-time spike in airplane deliveries in March; April’s drop represents the return to more typical export levels for the aerospace sector. In addition to aerospace, there were also notable declines in exports of agricultural products (1.4 per cent), raw metals and minerals (2.8 per cent), and electronics and electrical equipment (5.2 per cent).
In terms of export destinations, April’s gains were concentrated in three of Canada’s largest international customers – the United States, China and Mexico. Exports to the US were up 3.2 per cent, translating into a dollar-value increase of $1.1 billion. Exports to China jumped 11.5 per cent ($243 million) and have risen by 24 per cent since January, while deliveries to Mexico increased by 12.7 per cent. Those gains were dampened by large declines in exports to the United Kingdom, Japan, Germany and South Korea.
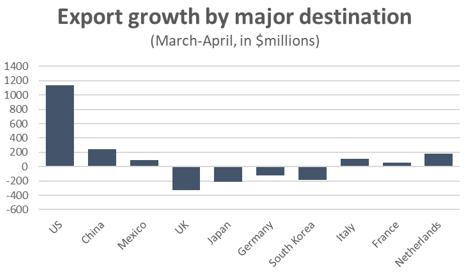
Graph showcasing export growth by major destination. Merchandise Trade Analysis, April 2018.
On the import side, the 2.5 per cent drop was relatively widespread, with declines in eight of the 11 major product categories. On a percentage basis, the largest decrease was in purchases of raw metals and minerals (6.2 per cent), with notable declines in motor vehicles and parts (5.8 per cent), as well as consumer goods (4.9 per cent). The only significant increase in imports was in energy products, where purchases were up 8.5 per cent.
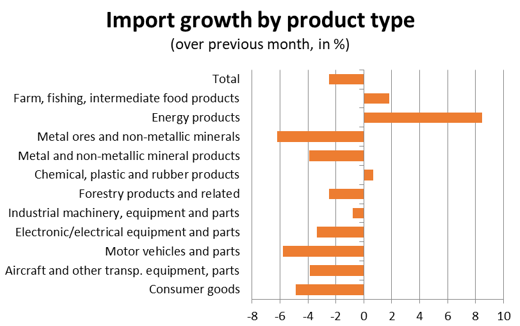
Graph showing import growth by product type. Merchandise Trade Analysis, April 2018.
Most of the decline in imports in April came from Canadians buying fewer Chinese goods. Imports from China had spiked in March, but gave back all those gains in April, with imports falling by 19.5 per cent on a month-over-month basis. Imports from the US were also down (1.4 per cent), and there was a large drop in shipments from Germany as well (17.0 per cent). Meanwhile, Canadians bought more goods from Mexico, the UK, Italy and South Korea.
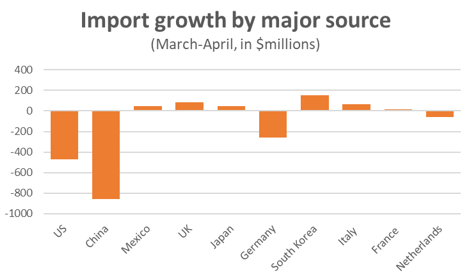
Chart showing import growth by major source. Merchandise Trade Analysis, April 2018.