International Trade
International Trade
Crude oil and precious metals push exports higher in January
Trade Overview
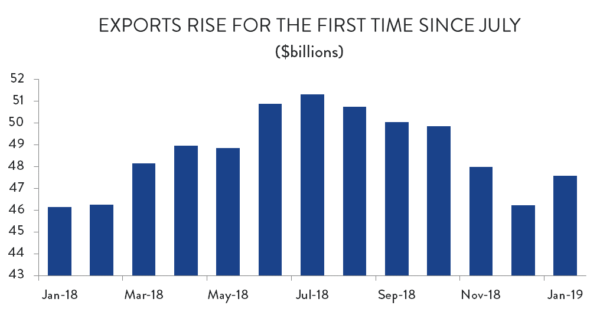
Canadian exports ended a five-month losing streak in January, aided by a surge in crude oil and precious metals deliveries.
After posting steep declines in each of the previous two months, exports rose by 2.9 per cent to start the year – enough to recover most of December’s losses. Monthly exports increased to $47.6 billion in January but remain 7.3 per cent below their July peak.
For their part, imports were up for the second month in a row after posting modest declines in each of the previous six months. Imports rose by 1.5 per cent in January, building on a (revised) 1.8 per cent increase in December. Those two increases were enough to overcome all the losses from May to November of last year, driving monthly imports up to $51.8 billion.
With exports growing almost twice as fast as imports, Canada’s record-level trade deficit narrowed slightly. From a (revised) $4.8 billion in December, the trade imbalance fell to about $4.2 billion in January.

Prices and Volumes
January’s export growth was driven by a combination of price and volume effects. Average export prices rose by 1.0 per cent compared to December, while export volumes were up by 0.9 per cent. The price increase was led by a recovery in crude oil valuations, which had plunged in November and December. A spike in deliveries of precious metals products led the way on the volume side.
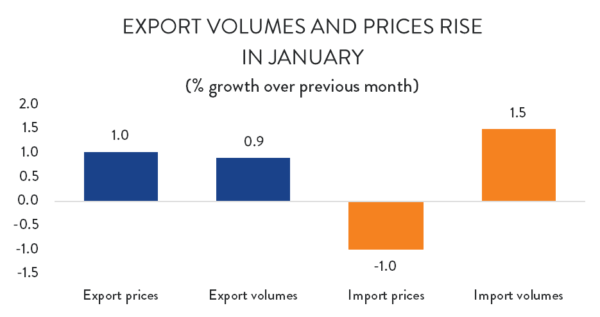
As for imports, Canadians paid less for imported good in January, but bought more of them. Average import prices fell by 1.0 per cent to start the year, while import volumes were up about 1.5 per cent.
Exports by Product Type
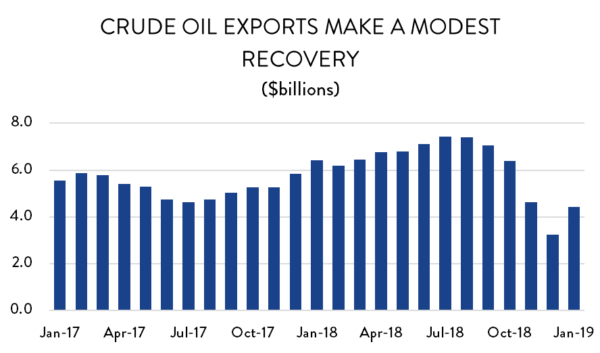
As noted above, crude oil and precious metal products were far and away the most important export growth drivers in January. In the case of crude oil, the increase was significant, but nevertheless represented a recovery of just a fraction of recent losses. Exports were up by what would otherwise have been a healthy 14.0 per cent ($1.2 billion). However, those gains came after declines of about 28 per cent in November and another 30 per cent in December. Even with January’s increase, crude oil exports remain 40 per cent below July’s levels.
For their part, unwrought precious metals and alloys exports recovered from a sharp drop in December and, at the same time, spiked to unusually high levels. Exports of those goods were up 62 per cent in January ($862 million).
Elsewhere, January’s export data were more typical. On the positive side, exports of industrial machinery and equipment were up 4.7 per cent ($160 million). Electrical and electronic goods exports were up 1.9 per cent ($49 million), and foreign deliveries of consumer goods were 1.0 per cent ($62 million) higher.
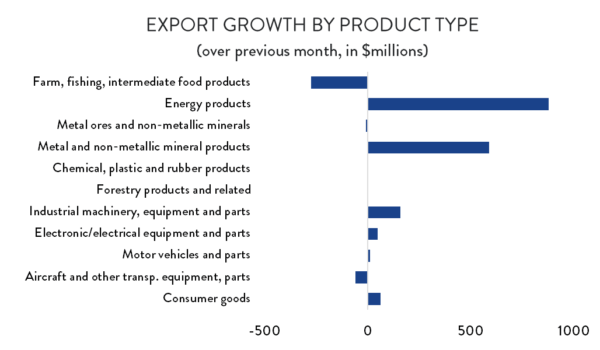
Meanwhile, January saw a relatively sharp decline in agricultural exports. While animal and fish-based exports were steady, shipments of wheat, canola and other crops were down considerably. Aerospace exports were also lower – falling by about 2.5 per cent ($60 million). There was little movement in most other major product categories.
Exports by Destination
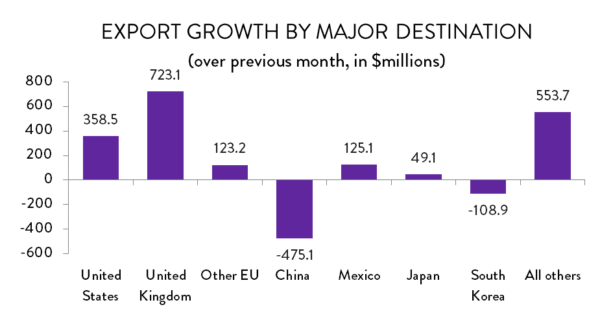
In terms of export destinations, by far the largest increase in January was in deliveries to the United Kingdom. Exports to that country rose by nearly 53 per cent ($723 million). That jump is almost certainly tied to the parallel spike in precious metals exports; the UK is far and away the largest buyer of Canadian gold.
Similarly, the increase in crude oil exports meant that exports to the United States were higher in January as well. However, the increase was more modest, as gains in crude oil were offset by declines elsewhere. All told, exports to the US were up 1.1 per cent ($359 million) compared to December. Exports to Hong Kong, Saudi Arabia, India and Mexico were also higher in January.
On the negative side, exports to China fell sharply in January, dropping by more than 17 per cent ($475 million). It’s worth noting that this decline predates China’s recent decision to ban imports of Canadian canola. Exports to South Korea also fell in January (18.8 per cent, or $109 million), as did sales to Norway and Indonesia.
Imports by Product Type
On the import side, gains were relatively widespread, with Canadian purchases up in seven of the 11 major product categories. By far the largest increase was in aerospace deliveries, which jumped by 53 per cent ($918 million). Imports of metal/mineral products ($204 million, or 6.1 per cent) and motor vehicles ($200 million, or 2.0 per cent) also posted notable gains.
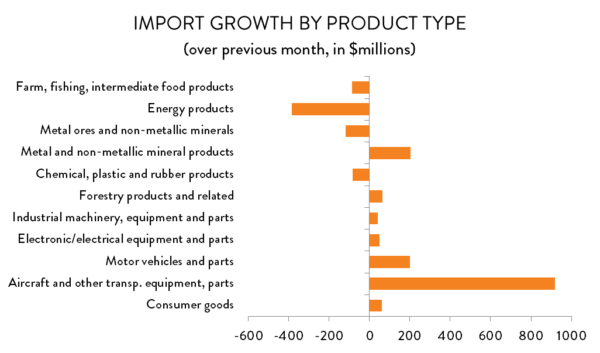
Meanwhile, imports of energy products and base metals/minerals were down in January. In both cases, the declines represented a climbdown from spikes in December: imports of energy products fell by 12.1 per cent ($385 million); while Canadian purchases of raw metals and minerals were 8.3 per cent ($118 million) lower.
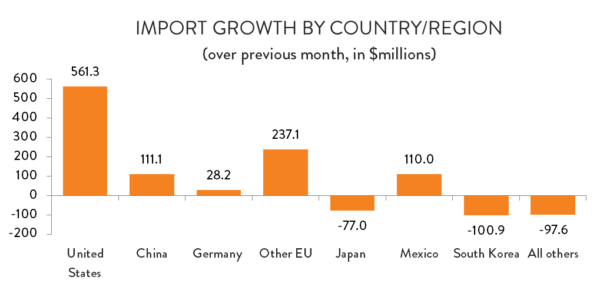
Imports by Country
January’s increase in imports came largely from the United States and the European Union. Overall imports into Canada were up by about $772 million compared to December. Of that total, imports from the US were $561 million higher (a 1.5 per cent increase), while deliveries from the EU were up $265 million (4.8 per cent). Within the EU, most import growth came from the UK and Belgium. Imports from China and Mexico were also higher, while deliveries from Brazil ($168 million) and South Korea ($101 million) were down considerably to start the year.