International Trade
International Trade
Higher crude oil prices effectively wipe out Canada’s trade deficit in July
After a long period of stagnation, Canadian exports are roaring back to life as a favourable price environment lifts the value of the country’s most important export product. All told, exports rose by 0.8 per cent in July to reach an all-time monthly record of $51.3 billion. While that month-over-month growth rate was not exceptionally high, it built off an exceptional showing in June, when exports spiked by 4.6 per cent (revised up from the 4.1 per cent reported last month).
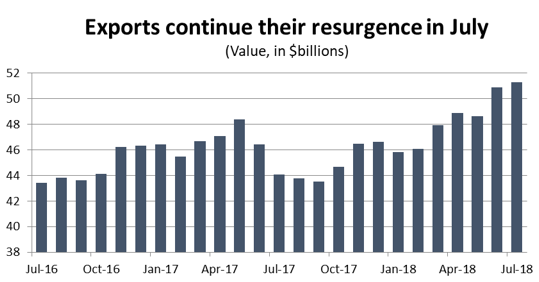
Graph showing that exports continue to resurgence in July. Merchandise Trade Analysis, July 2018.
As a result, Canada’s year-over-year export growth rate has exploded after stagnating for the first four months of the year. Exports in July were a full 16.3 per cent higher than they were 12 months earlier. Moreover, unless trade relations with the United States take a turn for the worse, that trend is likely to continue into the coming months. August through October 2017 was a period of weak growth for Canadian exports. It will take very little in the way of additional sales for year-over-year growth numbers to stay in the double digits.
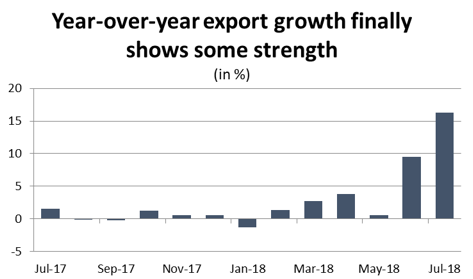
Graph showing that year-over-year export growth finally shows some strength. Merchandise Trade Analysis, July 2018.
Meanwhile, Canadians’ appetites for imported goods is fading. Imports dropped by 0.4 per cent in July (to $51.4 billion), marking the third time in four months that imports have been either flat or fallen. The combination of stagnant imports and soaring exports has produced a dramatic turnaround in Canada’s trade balance. As recently as March, the trade deficit was as high as $4.1 billion. In July, the gap between imports and exports had faded to just $114 million – Canada’s most favourable trade balance since a brief period of trade surplus at the end of 2016.
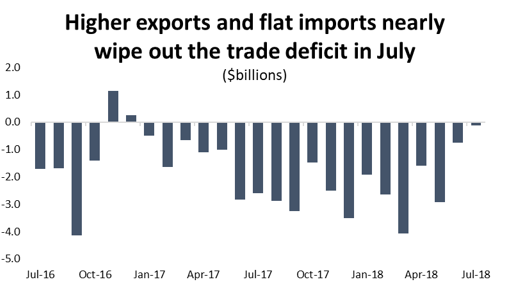
Graph showing that higher exports and flat imports nearly wipe out the trade deficit in July. Merchandise Trade Analysis, July 2018.
For both imports and exports, July was a month of lower-volume sales offset by higher prices. On the export side, average prices were up 0.9 per cent compared to June, led by a 7.5 per cent increase in crude oil prices. Meanwhile, sales volumes fell by 0.8 per cent, including a 2.3 per cent decline in crude oil volumes. As for imports, average prices were also 0.9 per cent higher in July, while volumes fell by 1.1 per cent.
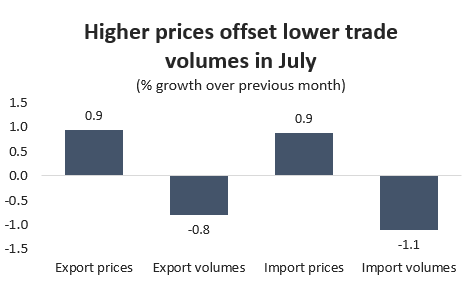
Graph showing that higher prices offset lower trade volumes in July. Merchandise Trade Analysis, July 2018.
In terms of export products, results were mixed as gains in five of the eleven major product categories were enough to overcome losses in the other six. Led by crude oil, energy product exports were 5.0 per cent higher in July – an increase of $489 million compared to June. July was also a good month for the automobile and parts exporters which have been struggling for some time now. Vehicles and parts exports rose by 3.4 per cent ($260 million), reaching their highest level since last June. There were also healthy gains in consumer goods exports (3.6 per cent, or $223 million), while increases elsewhere were relatively modest.
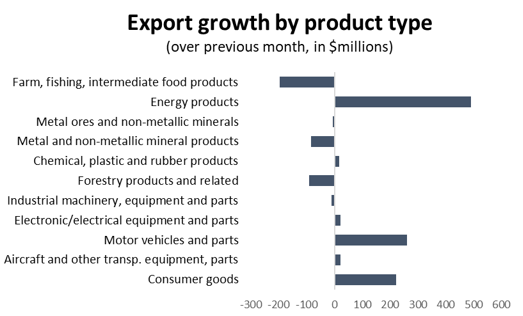
Graph showing export growth by product type. Merchandise Trade Analysis, July 2018.
On the other side of the spectrum, there was a sharp decline in aerospace exports, which fell by 9.1 per cent ($230 million). The good news is that the drop came after a 21 per cent spike in June, meaning that aerospace exports remain strong in general. The other weak point for exports was in agriculture and related products, which were down 6.5 per cent ($196 million) compared to June.
As was the case in June, most of Canada’s export gains in July were driven by higher sales to the United States. Southbound exports rose by more than $1.2 billion, building off a (revised) $976 million in crease in June. Shipments to the United Kingdom also spiked in July, rising by $480 million (38 per cent). There were also modest gains in exports to China and Italy, but sharp declines in many of Canada’s other major export destinations, including Mexico, Germany, Japan and India.
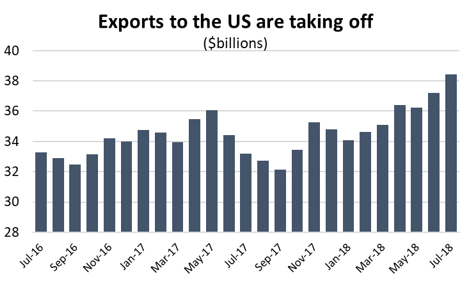
Graph showing that exports to the US are taking off. Merchandise Trade Analysis, July 2018.
Looking at imports into Canada, the decline in July was relatively widespread as purchases were down in seven of the eleven major product categories. Aerospace imports fell by $334 million (15.6 per cent), while imports of chemicals, plastics and rubber products were $180 million lower. There were also notable declines in imports of raw metals, minerals and associated intermediate products. Meanwhile, Canadians purchased more foreign energy and electronics in July.
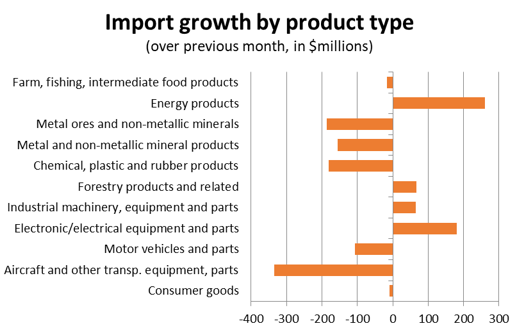
Graph showing import growth by product type. Merchandise Trade Analysis, July 2018.
July was also the month when Canada’s retaliatory tariffs against the United States came into effect. That likely contributed to the drop in metals and minerals imports and resulted in a modest 0.1 per cent decline in imports from our largest trading partner. Elsewhere, there were small increases in imports from the EU and China in July, while there were relatively sharp decline in deliveries from Japan and South Korea.
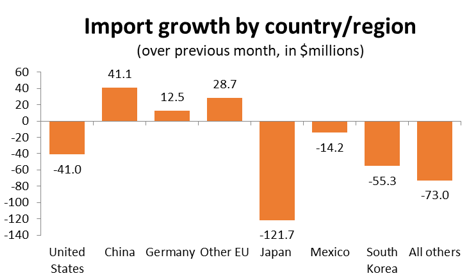
Graph showing import growth by country/region. Merchandise Trade Analysis, July 2018.