International Trade
International Trade
Exports fall on lower crude oil prices.
Canada’s two-way trade flows fell for the third month in a row, as both imports and exports were down in October.
Exports were driven lower by the combination of falling crude oil prices and a widening differential between the value of Canadian heavy crude and world benchmark prices. All told, exports fell by 1.2 per cent in October, adding to a (revised) 1.3 per cent decline the previous month. At $49.3 billion, monthly exports are now at their lowest level since May and 3.3 per cent below their July peak.
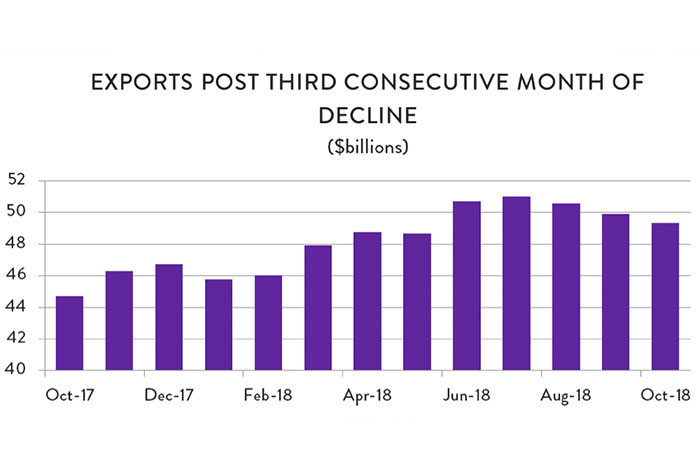
Graph showing that for the third month in a row, exports have declined. Merchandise Trade Analysis, October 2018.
Imports were also down in October, dropping by 0.3 percent to hit $50.5 billion. Imports have been trending lower since March, in large part because of declining trade in motor vehicles and parts, as well as aerospace equipment.
As was the case the previous month, Canada’s trade balance widened in October as exports fell by more than imports. The monthly trade deficit grew from a revised $891 million in September to $1.2 billion – the widest gap since May.
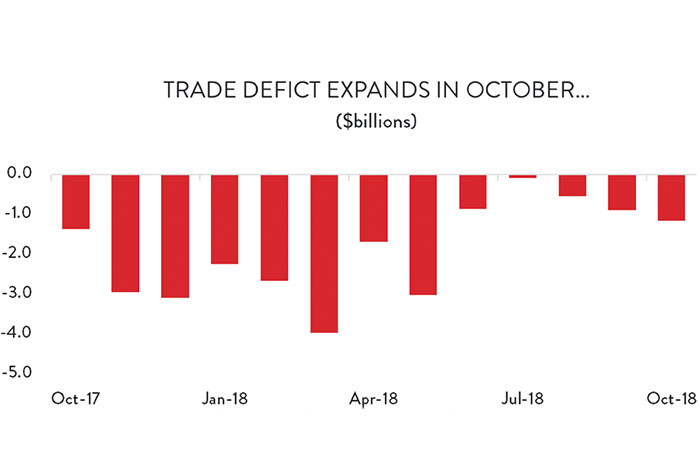
Chart showing the trade deficit expansion in October. Merchandise Trade Analysis, October 2018.
The decline in oil prices – which continued into November and December – is a major concern for future export growth and Canada’s international trade balance. Canada is a significant net exporter of crude oil and other energy products, while it carries a yawning trade deficit elsewhere. Effectively, the energy sector has been working overtime to minimize the net outflow of cash from the Canadian economy. Further declines in oil prices will only accelerate that outflow. The fact that Alberta is planning to cut production in a desperate attempt to shore up prices for domestic crude speaks volumes to the size of the challenge and the urgent need to relieve Canada’s pipeline transportation bottleneck. The lack of market access is costing the Canadian economy billions of dollars a year.
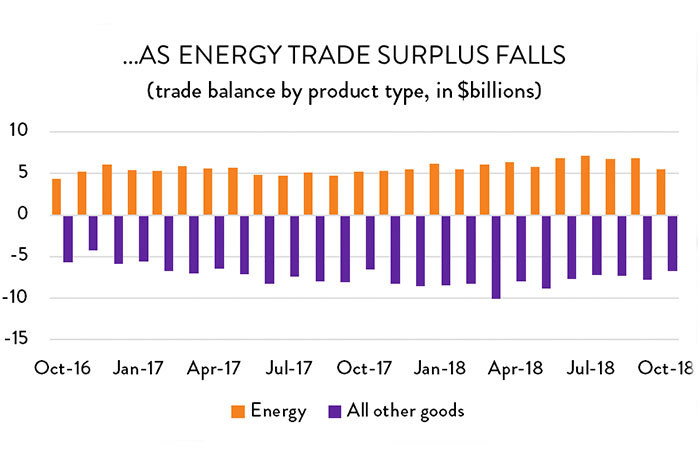
Graph demonstrating that the energy trade surplus fell in October. Merchandise Trade Analysis, October 2018.
The silver lining in October’s trade report is that the decline in exports was the result of price effects rather than a decline in export volumes. Exports volumes were relatively strong in October, rising by 1.2 per cent compared to the previous month. However, tumbling crude oil prices (down 7.8 per cent) drove overall export prices down by 0.8 per cent for the month. The size and importance of the energy sector to Canada’s export mix means that the 0.8 per cent price drop was more than enough to offset the 1.2 per cent increase in export volumes.
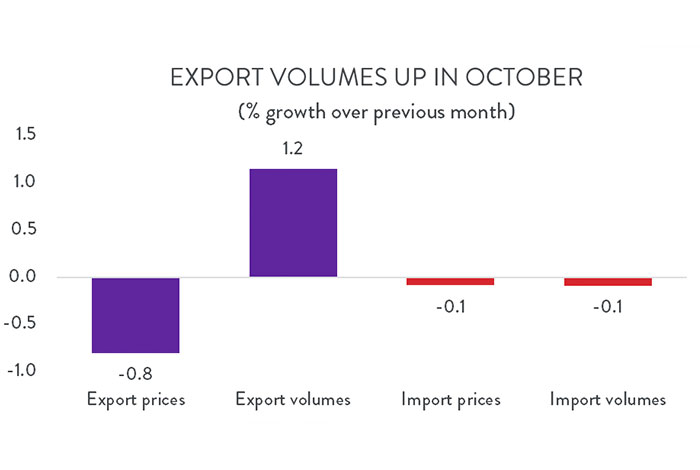
Chart showing that export volumes went up in October. Merchandise Trade Analysis, October 2018.
In terms of export products, there was more good news than bad in October. Of the 11 major product categories, six were higher, four were lower and one (aerospace vehicles and parts) was essentially unchanged. On the positive side, motor vehicles and parts exports rebounded in October, jumping by 4.4 per cent ($331 million). Even with that increase, however, autos and parts exports remain below July levels and are still 7.7 per cent lower than they were two years ago. Export gains were modest in the other five product groupings, with the largest increase coming in foreign sales of canola and other crops.
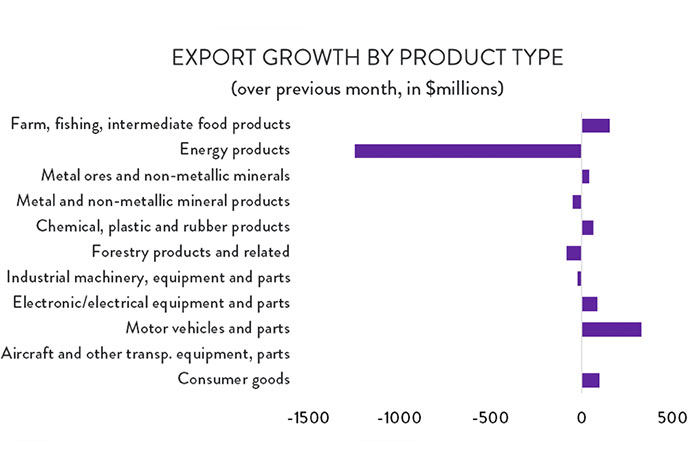
Chart showing the export growth by type of product. Merchandise Trade Analysis, October 2018.
On the negative side, the big story was obviously the energy sector, where exports fell by 12.4 per cent (almost $1.3 billion) in just one month. Price effects also weighed down forest products exports, while sales of metal and mineral products as well as industrial machinery were also lower.
Unsurprisingly, given that Canada’s energy exporters are captive to the US market, the decline in crude oil exports drove US-bound exports down sharply in October. Exports to that country fell by $874 million (2.3 per cent) compared to September. There was also a notable decline in exports to the United Kingdom (down 8.4 per cent, or $101 million), while sales to China and Mexico were also lower.
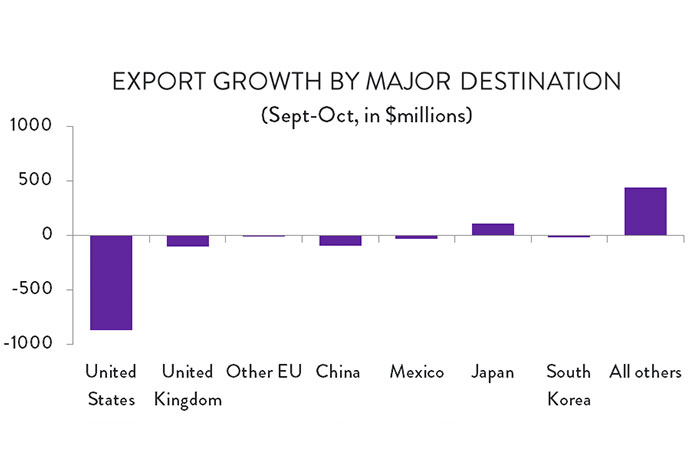
Chart showing the export growth by major destinations. Merchandise Trade Analysis, October 2018.
On the positive side, exports to several Asian markets were higher in October. Exports to Hong Kong – a major shipping hub – were up by $378 million, while deliveries to Japan ($107 million), India ($58 million) and Singapore ($36 million) were all higher as well.
Imports into Canada were largely to the down side as well, with Canadian purchases rising in just three of the 11 major product categories. Even as Canadian energy exports plunged, domestic consumers purchased more foreign crude oil, driving energy imports up by 2.7 per cent ($87 million). The largest increase in imports, however, came in the aerospace sector, where deliveries into Canada jumped by 11.3 per cent ($173 million).
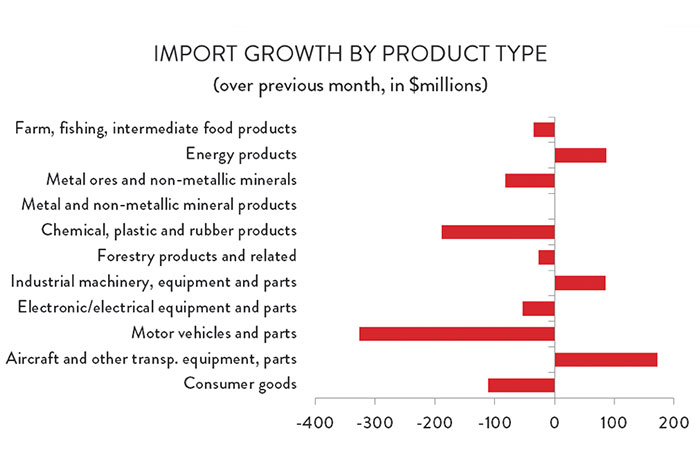
Chart featuring import growth by product type. Merchandise Trade Analysis, October 2018.
On the negative side, imports of motor vehicles and parts were down considerably ($326 million, or 3.5 per cent). There was also a notable decline in chemical products imports ($189 million, or 4.5 per cent), with smaller decreases in consumer goods and primary metals.
Canadians purchased more goods from the US in October, as imports from that country were up by 1.3 per cent ($413 million). However, that increase was more than offset by lower imports from most o Canada’s other major trading partners. Imports from China were down 4.8 per cent ($194 million), imports from the EU were 2.7 per cent lower ($139 million), and purchases of Japanese ($153 million) and Saudi Arabian ($111 million) goods were also down.
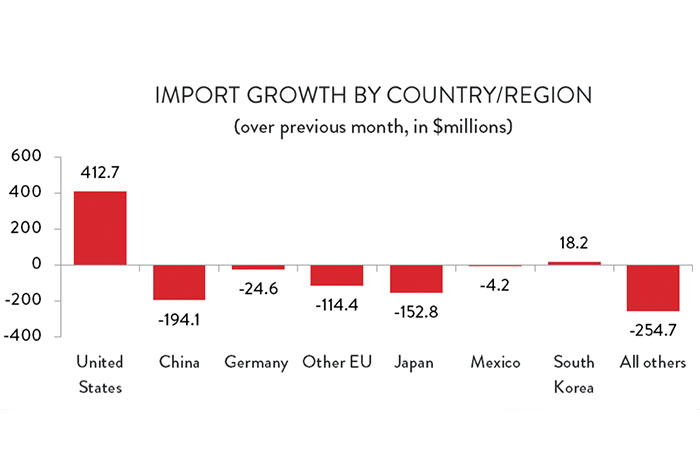
Chart showing the import growth by country/region. Merchandise Trade Analysis, October 2018.