Canadian Economy
Canadian Economy
GDP growth slows as manufacturing retreats from its July high.
The Canadian economy posted sluggish growth in August, as the manufacturing sector retreated from its strong performance in July. All told, GDP increased by less than 0.1 percent for the month, equivalent to an annualized increase of under 1.0 percent.
Evidence is beginning to mount that economic activity in Canada is slowing down. August marks the third time in five months that the economy grew at an annualized rate of less than 1.0 percent. On top of that, there was a significant downward revision to July’s GDP numbers. A month ago, economic growth for July was estimated to have come in at about 2.7 percent on an annualized basis. That figure was revised to 1.9 percent.
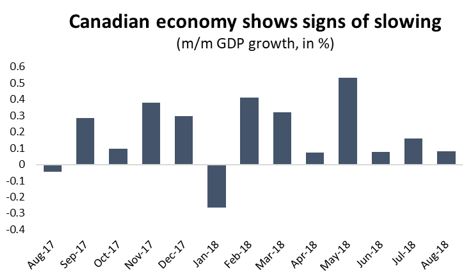
Graph showing that the Canadian economy shows signs of slowing. Economic Analysis: GDP, August 2018.
In spite of slower month-over-month growth, the Canadian economy still looks good compared to last year. Because of a weak performance 12 months earlier, GDP growth so far in 2018 is tracking at about 2.7 percent compared to the first eight months of 2017. Look for that growth rate to slow as the year winds down, however; sluggish current growth, combined with a surge in economic activity last fall and winter, will push annual growth rates closer to 2.0 percent for 2018.
Modest overall growth in August was largely the result of weakness in manufacturing dampening a surge in the energy sector and financial services. On the positive side, energy sector GDP jumped by 1.0 percent in August ($1.8 billion) – equivalent to an annualized increase of nearly 12.5 percent. The increase in finance and insurance GDP was nearly identical in size. Meanwhile, manufacturing GDP tumbled by 0.6 percent ($1.1 billion) – an annualized decline of 7.0 percent.
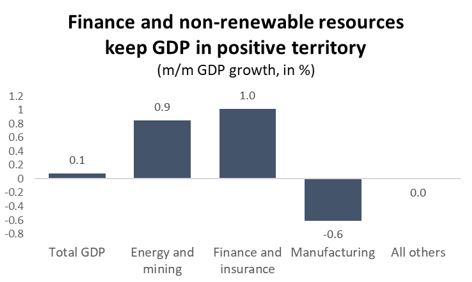
Graph showing finance and non-renewable resources keep GDP in positive territory. Economic Analysis: GDP, August 2018.
While finance and energy led the way in August, it was also a good month for a number of services industries, including real estate, professional services, and health care. The one notable weak spot in the services sector was in wholesale and retail trade. Of note, retail trade GDP has fallen for three months in a row as consumer spending levels have not budged since May.
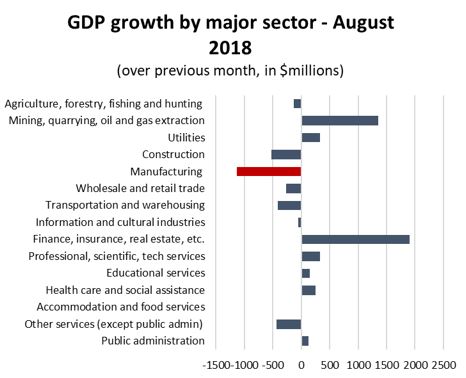
Graph showing GDP growth by major sector. Economic Analysis: GDP, August 2018.
The decline in manufacturing GDP was the big story on the goods side. However, there was also a notable drop in construction activity (4.9 percent on an annualized basis), as well as in agriculture and forestry (5.3 percent). Countering those losses was the above-mentioned surge in the energy sector, as well as a healthy increase in electrical power generation, transmission and distribution.
Looking more closely at the manufacturing sector, while the headline month-over-month decline in GDP may seem dramatic, that drop came after a huge spike in value-added activity in July and only gave back a fraction of those gains. Last month, it was estimated that manufacturing GDP jumped by 1.24 percent in July (an annualized rate approaching 15 percent). That figure was revised upward to 1.42 percent (18.4 percent annualized).
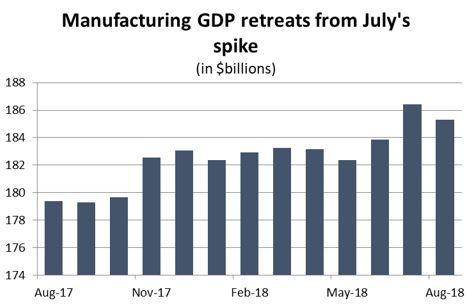
Graph showing that manufacturing GDP retreats from July's spike. Economic Analysis: GDP, August 2018.
As a result, the 7.0 percent annualized decline in August represented only a partial retreat from July’s high. Sectoral GDP is still at its second-highest monthly level on record and well above where it was in June.
The drop in manufacturing GDP in August was widespread, with nine of the eleven largest sub-sectors posting declines. In many cases, however, those losses were a reflection of the overall sectoral trend – a partial retreat from a surge in July. That was the case in food processing, chemicals production, petroleum refining, and machinery output.
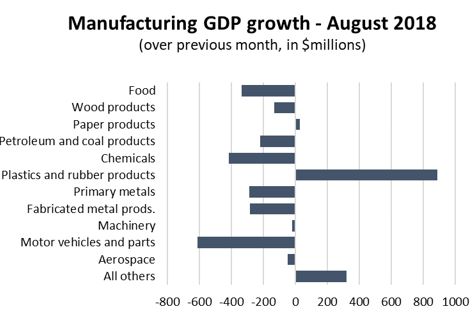
Graph showing manufacturing GDP growth in August. Economic Analysis: GDP, August 2018.
However, there were industries where August’s GDP numbers were of greater concern. In particular, the auto sector continues to struggle, as GDP fell to its lowest level since last October when a labour stoppage caused output levels to plummet. Aerospace GDP has also fallen in three consecutive months, while value-added production in primary metals and minerals industries is flat or falling.
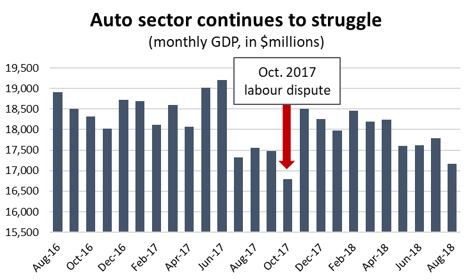
Graph showing that the auto sector continues to struggle. Economic Analysis: GDP, August 2018.
On the positive side, there was a surge in value-added production in plastics and rubber products, and continued gains in several of Canada’s smaller manufacturing sub-sectors. Those include: beverage products; computer and electronic products; and electrical equipment, appliances and related components.