Labour Market Trends
Labour Market Trends
Ontario job losses in August cancel out July’s gains.
Broadly speaking, August’s labour market numbers were the inverse of those in July. In July, Canada gained about 54,100 jobs, most of which were in part-time jobs in Ontario. In August, by contrast, employment fell by 51,600 positions. Job losses were almost exclusively in Ontario and were entirely in part-time positions.
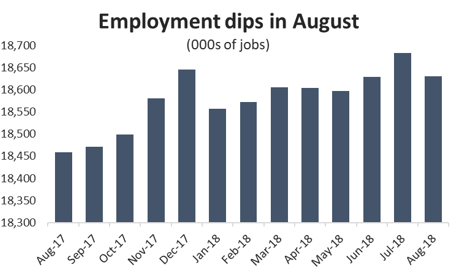
Graph showing that employment dips in August. Labour Force Survey Analysis, August 2018.
August’s jobs numbers also add to the mounting evidence that Canada’s labour markets is cooling. The 0.3 per cent decline in employment last month marks the fourth time in eight months that employment has fallen. To be clear, gains have outstripped losses over that period and year-over-year job growth remains in positive territory. However, total employment is now less than one per cent higher than it was 12 months ago.
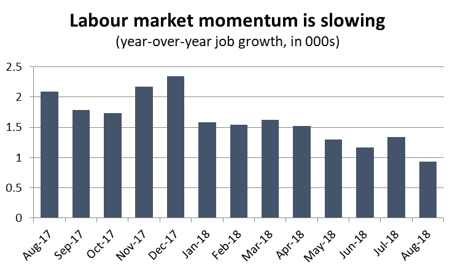
Graph showing that labour market momentum is slowing. Labour Force Survey Analysis, August 2018.
Job losses in August also bumped the unemployment rate up to 6.0 per cent compared to 5.8 per cent in July. The increase in the jobless rate was dampened slightly by a modest decrease in the share of Canadians actively looking for work.
The good news is that the Canadian economy created about 40,400 net new full-time jobs in August – an increase of about 0.3 per cent. However, those gains were easily wiped out by the elimination of 92,000 part-time positions – a 2.6 per cent decline. In fact, the creation of full-time jobs at the expense of part-time work is a general trend that we have seen through most of 2018 so far. Through eight months, full-time employment is 2.1 per cent higher compared to the same period last year, while part-time employment is tracking 1.8 per cent lower.
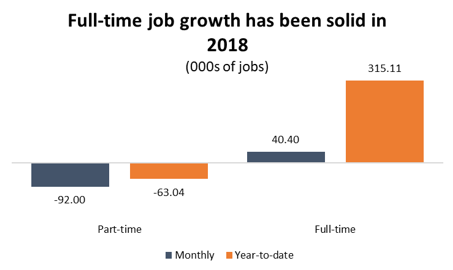
Graph showing that full-time job growth has been solid in 2018. Labour Force Survey Analysis, August 2018.
The addition of more full-time jobs also contributed to a modest increase in average wages across the country. On a year-over-year basis, wages are about 2.9 per cent higher than they were a year ago. While that growth rate is reasonably strong, it has been tracking downwards since April as the job market cools.
As noted above, job losses in August were heavily concentrated in Ontario. After adding more than 95,000 jobs in June and July combined, the province gave back most of those gains by shedding 80,100 jobs in August. Losses were widespread, as 12 of the 16 major sub-sectors in the province had lower employment numbers compared to July.
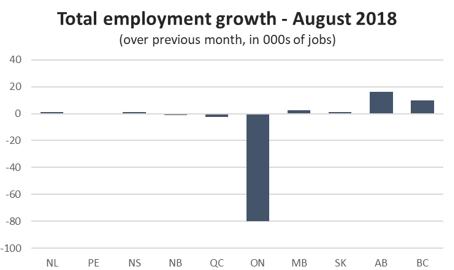
Graph showing total employment growth. Labour Force Survey Analysis, August 2018.
Elsewhere, jobs losses were relatively modest. There were 2,300 fewer jobs in Quebec in August and 1,100 fewer in New Brunswick. Employment was also down in PEI last month.
On the positive side, employment was up in Newfoundland and Labrador and all across western Canada. Alberta led the way with 16,200 net new jobs in August. BC and Newfoundland are both seeing a rebound from recent declines, while Manitoba and Saskatchewan saw gains, but are exhibiting no clear growth trend.
Since Ontario drove national unemployment lower and losses in that province were spread across a wide range of industries, it should come as no surprise that the same is true for Canada as a whole. Four of the five goods-producing sectors saw lower employment in August, led by a 16,400-job decline in construction (1.1 per cent). On the services side, results were mixed, with six of the eleven sub-sectors lower. Services job losses were highest in professional, scientific and technical services (22,100 jobs lost) and in wholesale/retail trade (19,600 jobs).
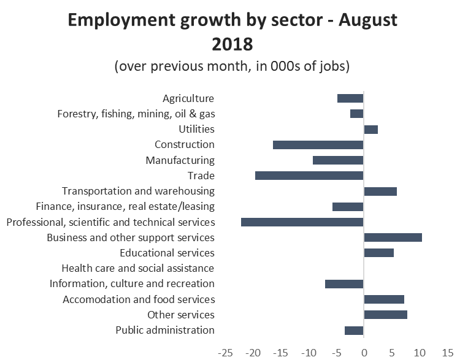
Graph showing employment growth by sector. Labour Force Survey Analysis, August 2018.
Manufacturing Sector Labour Market
August was another disappointing month on the jobs front for manufacturing. While the sector continues to perform well on an output basis in 2018, higher production levels are not translating into new jobs. There were 9,200 fewer manufacturing jobs in August compared to July – a decline of about 0.6 per cent. Employment has fallen in six of the last seven months and there are more than 60,000 fewer manufacturing jobs in Canada today compared to the beginning of the year.
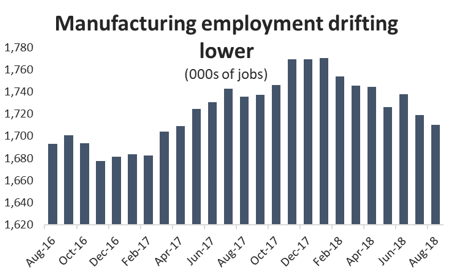
graph showing that manufacturing employment is drifting lower. Labour Force Survey Analysis, August 2018.
On a year-to-date basis, manufacturing employment through eight months is still tracking 1.4 per cent higher than it was over the same period in 2017. That won’t last. Manufacturing employment rose steadily throughout the year in 2017 while this year, it is doing the opposite.
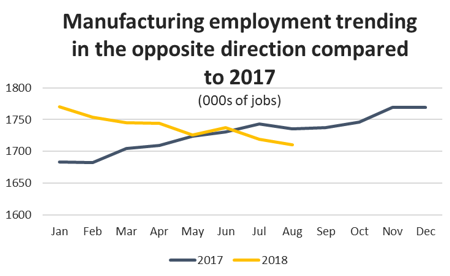
Graph showing that manufacturing employment is trending in the opposite direction compared to 2017. Labour Force Survey Analysis, August 2018.
Manufacturing job losses in August were heavily concentrated in BC. Employment plunged by 3.4 per cent compared to July as provincial manufacturers let go of an estimated 5,900 workers. There were also sharp declines in Nova Scotia (2,400 jobs, or 7.3 per cent) and Manitoba (2,600 jobs, or 4.1 per cent).
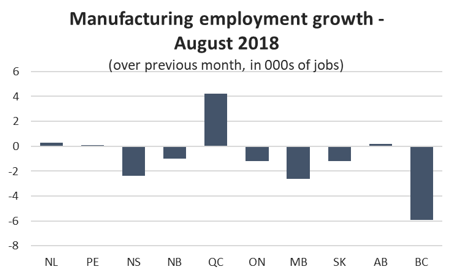
Graph showing manufacturing employment growth. Labour Force Survey Analysis, August 2018.