Canadian Economy
Canadian Economy
Flat GDP in June tempers a solid second quarter result.
There was essentially no growth in the Canadian economy in June, but the momentum generated from a strong showing in May helped propel the country to a solid overall result for the second quarter.
Beginning with the monthly numbers, GDP was effectively unchanged compared to May. A decline in mining and energy, as well as in wholesale and retail trade erased broad gains in the services sector and kept month-over-month GDP growth to 0.02 per cent – equivalent to an annualized increase of just 0.25 per cent.
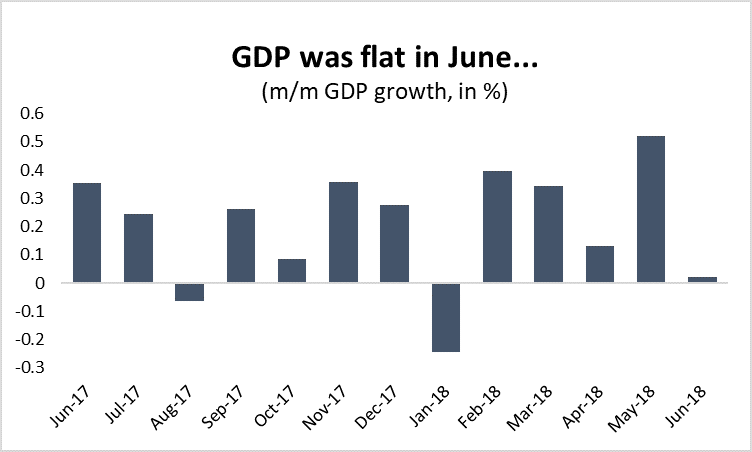
Graph showing that GDP was flat in June. Manufacturing GDP Analysis, June 2018.
The good news is that the surge in economic activity in May propelled the Canadian economy to a relatively strong second-quarter result. GDP growth in Q2 came in at an annualized rate of 2.9 per cent – its best quarterly performance in a year.
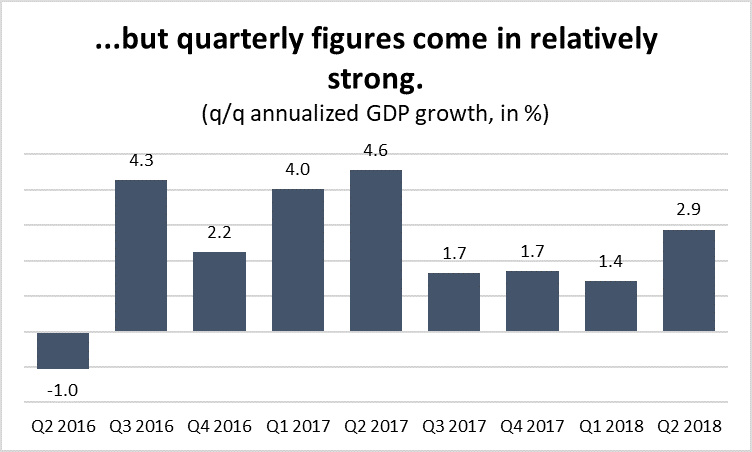
Graph showing that quarterly figures have come in relatively strong. Manufacturing GDP Analysis, June 2018.
Growth in the second quarter was largely driven by a long-awaited resurgence in Canadian exports. Propelled by the impact of higher energy prices on sales of crude oil, GDP in exports jumped by 2.9 per cent compared to the previous quarter – an annualized increase of about 12.3 per cent. Household spending also bounced back after a weak first quarter; growth in Q2 came in at an annualized rate of 2.6 per cent, after expanding by just 1.0 per cent in the previous quarter.
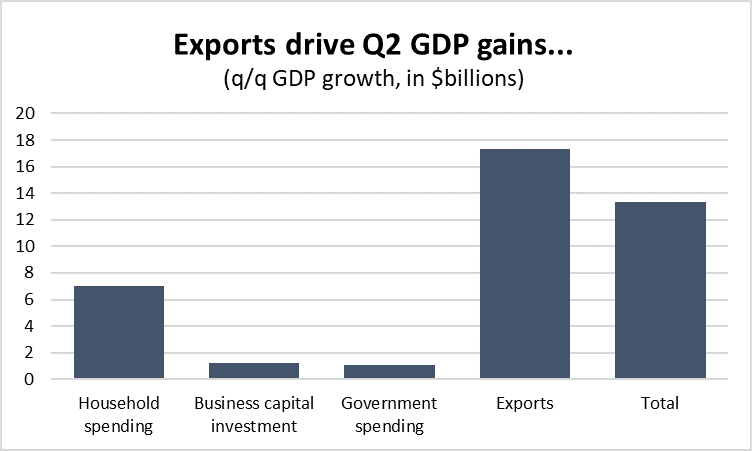
Graph showing that exports drive Q2 GDP gains. Manufacturing GDP Analysis, June 2018.
For its part, business investment in Canada was also positive last quarter, but growth is clearly slowing. Gross fixed capital formation has been gradually recovering after being hit hard by the impact of lower energy prices a few years ago. Last quarter, investment grew at an annualized rate of 1.5 per cent – its slowest increase since the recovery began. It is also worth noting that even after all this time, GDP in business capital investment remains 1.5 per cent below its peak in Q1 2015.
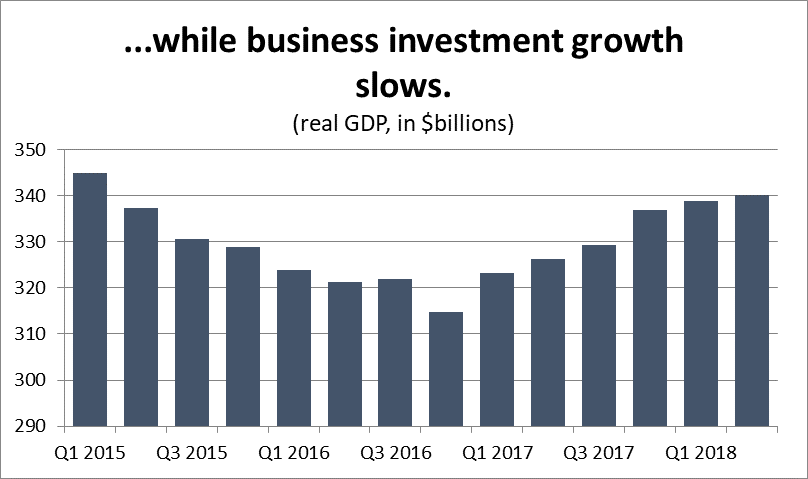
Graph showing that business investment growth is slowing. Manufacturing GDP Analysis, June 2018.
Turning back to the monthly GDP numbers, the story in June was one of broad gains in the services sector offsetting general declines in goods production. GDP was lower in every goods-producing sub-sector with the sole exception of manufacturing. Mining and energy activity fell by 10.2 per cent with most of those losses concentrated in the energy extraction side. Construction activity was 2.6 per cent lower, while utilities GDP fell by 5.3 per cent (all figures are on an annualized basis).
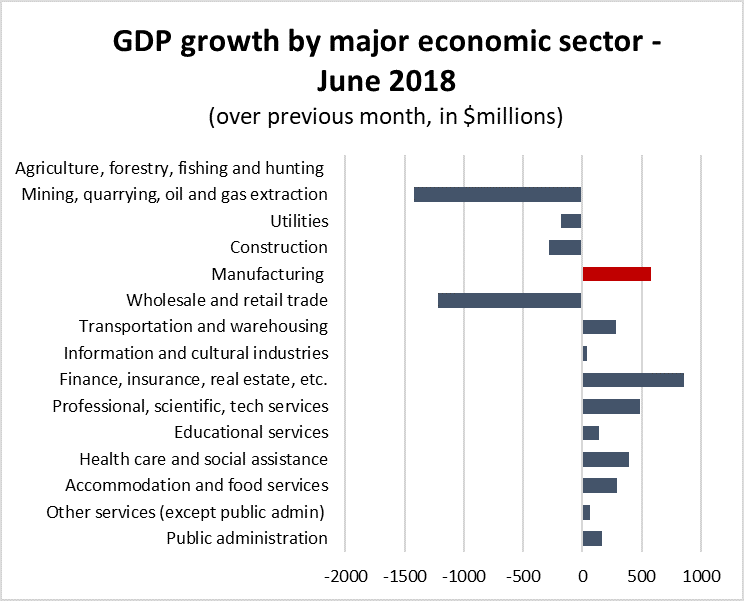
Graph showing GDP growth by major economic sector. Manufacturing GDP Analysis, June 2018.
Meanwhile, wholesale and retail trade were the only major weak spots in the services sector. In spite of a 10.7 per cent drop in wholesale trade activity, overall GDP in services was up 1.6 per cent on an annualized basis in June. Real estate, rental and leasing industries had a strong month, as did those in professional services and health care/social assistance.
For its part, the manufacturing sector posted relatively solid gains in June. Compared to May, overall GDP was up 0.3 per cent – equivalent to an annualized increase of about 3.8 per cent.
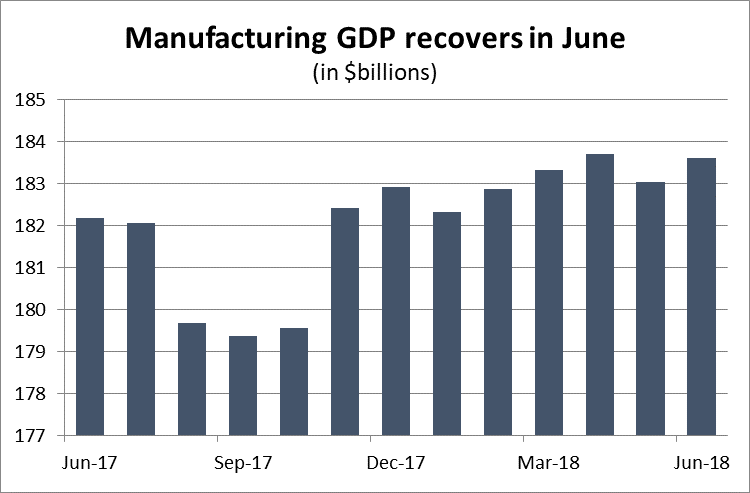
Graph showing a GDP recover in June. Manufacturing GDP Analysis, June 2018.
The bad news, however, is that this growth came after a rather substantial downward revision to the May GDP numbers for manufacturing. Last month, we reported that GDP was relatively flat in May – rising by about 0.1 per cent compared to April. In today’s release, those figures were adjusted so that GDP actually fell by 0.4 per cent in May – an annualized decline of 4.3 per cent. As a result of those adjustments, solid growth in June now brings overall manufacturing GDP to about the same levels as we saw in April.
In spite of the overall gains within the manufacturing sector, on an industry-by-industry basis growth was largely to the negative in June. Of the eleven major industrial groupings in Canada, only four were higher. However, growth in those four was more than enough to offset declines elsewhere. Leading the way was a spike in oil refinery output, which jumped by 17.5 per cent after shutdowns plagued the industry in April and May. June was also a bounceback month for fabricated metals producers. GDP gains of 4.1 per cent helped offset most the 6.0 per cent decline in May. GDP was also notably higher in wood products, plastics and rubber products, and in the smaller electrical equipment and appliances sub-sector.
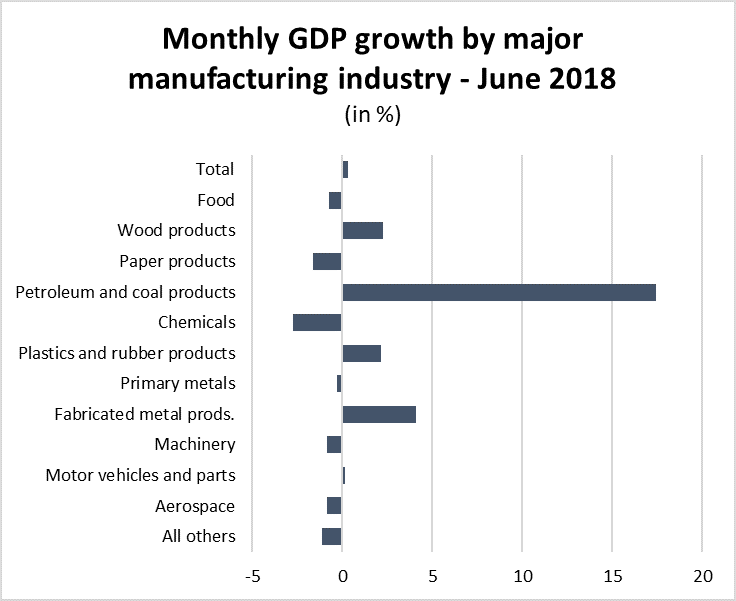
Chart showing the monthly GDP growth by major manufacturing industry, Manufacturing GDP Analysis, June 2018.
Leading the way on the negative side were chemicals-producing industries, where GDP fell by 2.7 per cent compared to May. Most of the other big declines came in Canada’s smaller manufacturing industries. GDP in printing and related activity dropped by 8.7 per cent. Value-added activity in non-metallic mineral products was 3.9 per cent lower and GDP in beverage- and tobacco-producing industries was down 2.7 per cent.