Manufacturing Sales
Manufacturing Sales
Weakness in motor vehicles production drives manufacturing output lower to start 2018.
The manufacturing sector stumbled out of the gate in 2018 as widespread declines drove sales down for the second month in a row. Unlike December’s modest decline, however, the drop in output was considerable; overall manufacturing fell by 1.0 per cent in January, to $54.9 billion.
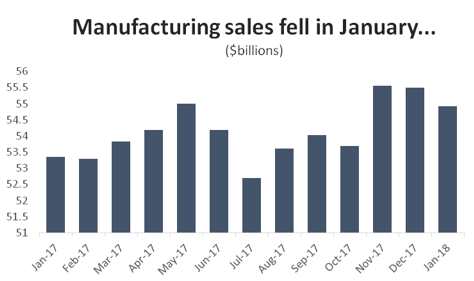
Graph showing that manufacturing sales fell in January. Manufacturing Sales Report, January 2018.
Adding to the disappointment, that decline was not the result of lower prices deflating the value of Canadian-made goods. Manufacturing sales volumes were down by 1.1 per cent in January, suggesting that the decline in output came in spite of a (very) modest increase in prices.
Unfortunately, the bad news extends into the forward-looking indicators as well. New orders (not including aerospace) tumbled 2.3 per cent in January, led by a significant drop in demand for machinery, as well as motor vehicles and parts. The silver lining is that new orders remain strong relative to this same period last year. New orders had been rising steadily since last summer and even with the large decline in January, they remain about 1.0 per cent higher than they were at this same point last year.
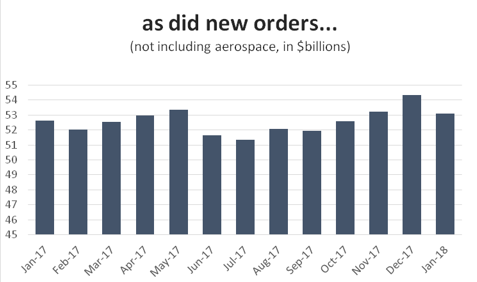
Graph showing that new orders have fallen. Manufacturing Sales Report, January 2018.
With fewer new orders coming in, manufacturers were also able to clear up some of their backlog of work. Unfilled manufacturing orders fell by about 0.6 per cent in January, once again driven lower my machinery and auto producers.
Looking at output by industry figures for January, results were largely to the negative. Of the eleven major manufacturing sub-sectors in Canada, only four saw sales increase that month. The largest gains were in petroleum refining, where sales were up a healthy 6.5 per cent ($374 million), as well as in chemicals production (6.1 per cent, or $269 million). Fabricated metals output was up 1.6 per cent ($43 million), while food processing businesses were able to eke out a 0.1 per cent gain ($9 million).
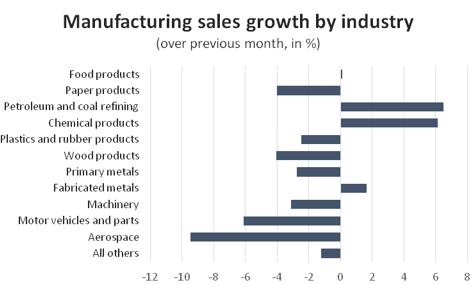
Graph showing manufacturing sales growth by industry. Manufacturing Sales Report, January 2018.
Elsewhere, the news was not good. The largest dollar-value decline was in motor vehicles and parts, where total output fell by $502 million (6.1 per cent). On a percentage basis, however, it was the aerospace sector which was hit the hardest. Aerospace output tumbled by 9.5 per cent ($166 million), dropping to its lowest level in 12 months. There were also notable declines in output of forest products, machinery and primary metals in January.
In spite of the widespread losses at the industry level, results were more mixed across the provinces. Sales were up in five provinces, although losses in the other five clearly outstripped those gains. Leading the way on the positive side were Saskatchewan and Alberta – the provinces where petroleum refining and chemicals are most important. Sales in Saskatchewan were up 5.7 per cent, recovering most of the losses from a steep decline in December. In Alberta, manufacturing sales were up 1.1 per cent, marking the sixth consecutive monthly increase in that province.
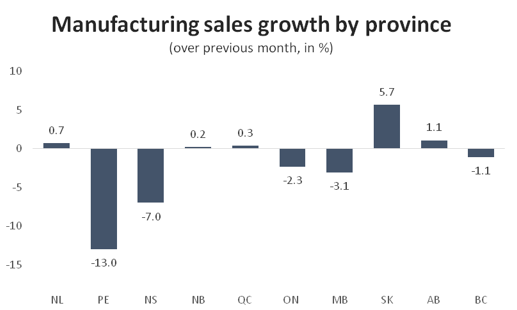
Graph showing manufacturing sales growth by province. Manufacturing Sales Report, January 2018.
At the other end of the spectrum, January was a rough month in Ontario. Driven lower by weakness in the auto sector, total sales were down 2.3 per cent – nearly $600 million – compared to December. There were also significant declines in PEI (13.0 per cent), as well as Nova Scotia (7.0 per cent) and Manitoba (3.1 per cent).