Manufacturing Sales
Manufacturing Sales
Auto sector recovery keeps overall manufacturing sales flat in September.
There was little change in Canadian manufacturing activity in September as a rebound in the auto sector was offset by sharp declines in production of machinery and wood products.
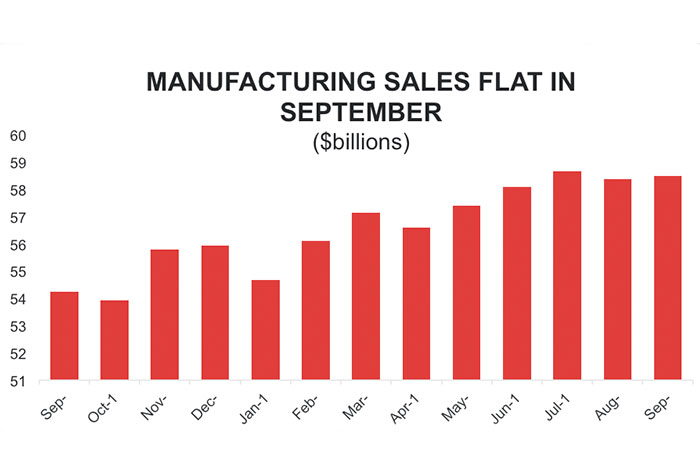
Graph showing that manufacturing sales have been flat in September. Manufacturing Sales Report, September 2018.
Overall, manufacturing sales were up modestly, rising by 0.2 per cent to reach $58.5 billion in September. While nominal sales remain near their all-time monthly highs, production appears to have flattened out after a strong first half of the year. From January to June, sales growth was swift, with overall output levels rising by 6.2 per cent in just six months. Since then, however, there has been little in the way of additional growth; from June to September, sales have increased by just 0.7 per cent.

Chart showing that sales growth has been stagnant since June. Manufacturing Sales Report, September 2018.
Although month-to-month manufacturing sales have been flat since June, things still look a lot better than they did at this same point last year. September’s sales figures are 7.8 per cent higher than they were 12 months ago, and with three quarters of the year in the books, sales through 2018 are tracking 6.1 per cent higher than they were through the first nine months of 2017.
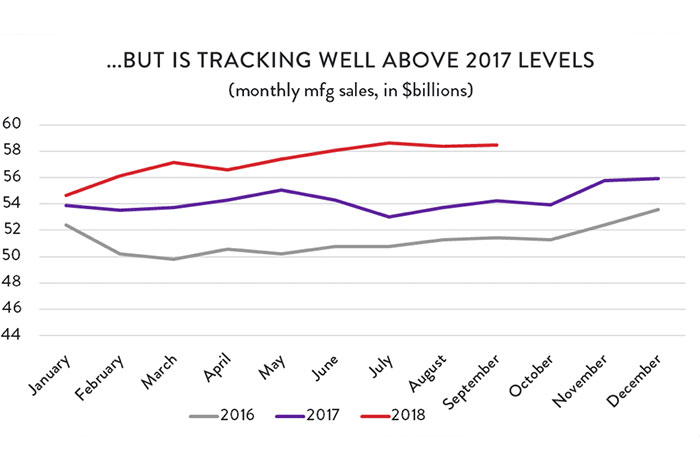
Chart showing that sales growth have been tracking well above 2017 levels. Manufacturing Sales Report, September 2018.
Broadly speaking, the modest increase in manufacturing activity in September was the result of a small dip in production volumes, countered by a modest improvement in the prices that Canadian manufacturers received for their goods. Inflation-adjusted manufacturing sales were down by 0.1 per cent compared to August, with the largest volume-based declines in machinery, wood products, clothing and textiles, and electrical/electronic appliances and components.
As in August, forward-looking indicators continue to point to a mild softening of growth conditions for Canadian manufacturers. New, non-aerospace orders declined for the second month in a row, falling by 0.9 per cent in September, after a 1.0 per cent decrease the previous month. The silver lining is that new orders are still considerably higher than they were at this same point last year – by about 11 per cent.
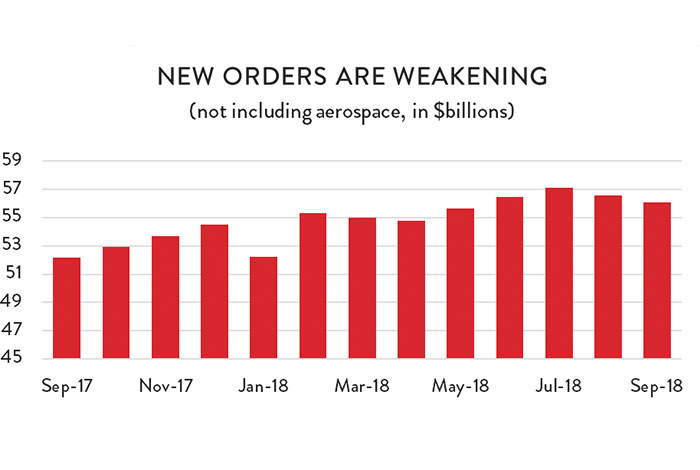
Graph showing that in September new orders have weakened.Manufacturing Sales Report, September 2018.
Unfilled orders were also lower in September as businesses were able to put a dent in their growing backlog of work. Unfilled orders (not including aerospace) were down by 0.8 per cent compared to August, after rising steadily for five months in a row.
As noted above, the main story at the industry level was a recovery in auto sector production offsetting declines in machinery and wood products output. Autos and parts output had plunged by (a revised) 4.7 per cent in August ($393 million), but recovered almost all of those losses the next month; motor vehicles and parts production was up 4.4 per cent in September ($350 million). Elsewhere on the positive side, petroleum and chemicals producers saw solid growth, with output rising by 0.9 per cent and 1.4 per cent, respectively. The increase in petroleum output is something of a surprise given that Canada’s largest oil refinery shut down for scheduled maintenance in September. There were also sales gains made in the aerospace, and plastics and rubber products industries.
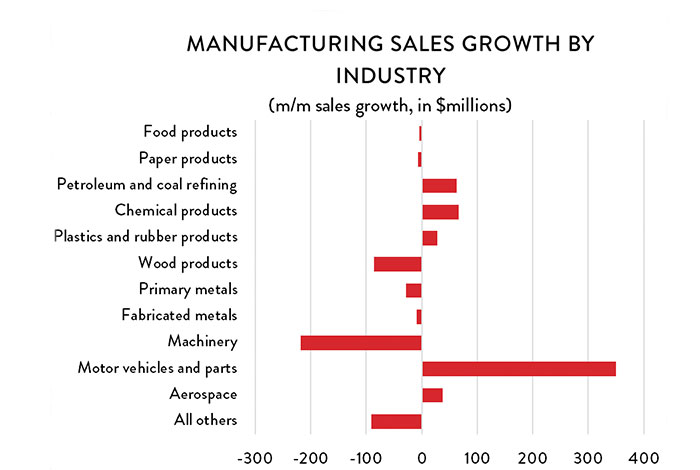
Graph showing the manufacturing sales growth by industry. Manufacturing Sales Report, September 2018.
On the negative side, there was a sharp decline in machinery production as the industry gave back most of the gains it had made in the previous four months. Machinery sales fell by 6.2 per cent compared to August and are now at about the same level as they were in April. Market conditions for Canada’s wood products industries have also turned rocky. Production has now fallen for four consecutive months, including a 2.9 per cent decline in September.
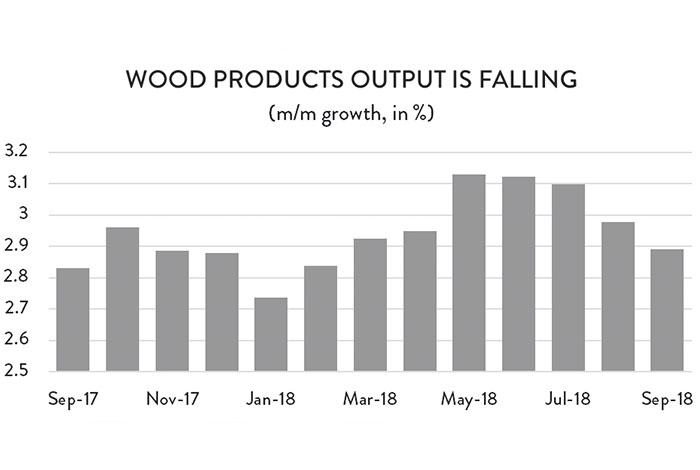
Graph demonstrating that the output of wood products in falling. Manufacturing Sales Report, September 2018.
Looking across the country, manufacturing sales were higher in most provinces compared to August. Leading the way on a dollar-value basis was Ontario, where the recovery in auto production contributed to a 0.6 per cent increase in provincial sales activity ($162 million). On a percentage-growth basis, however, Newfoundland and Labrador was the runaway leader. After a sharp decline in August, output roared back to life, rising by 21 per cent and reaching its highest level since April. Nova Scotia and PEI manufacturers also made considerable gains in September, with smaller percentage increases in Alberta and BC.
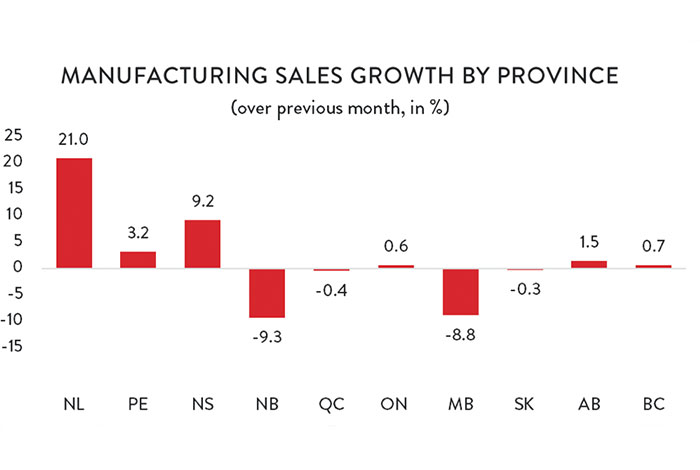
Graph showing the growth in manufacturing sales by province in September. Manufacturing Sales Report, September 2018.
Those gains were effectively wiped out by sharp losses in two provinces: New Brunswick and Manitoba. Manufacturing sales in New Brunswick fell by 9.3 per cent ($157 million) compared to August – largely the result of scheduled maintenance impacting production at the Saint John refinery. In Manitoba, output was down by 8.8 per cent, as primary metals output plunged in the province.