International Trade
Merchandise Trade
July 2022
Exports Post First Monthly Decline This Year, Trade Surplus Shrinks
HIGHLIGHTS
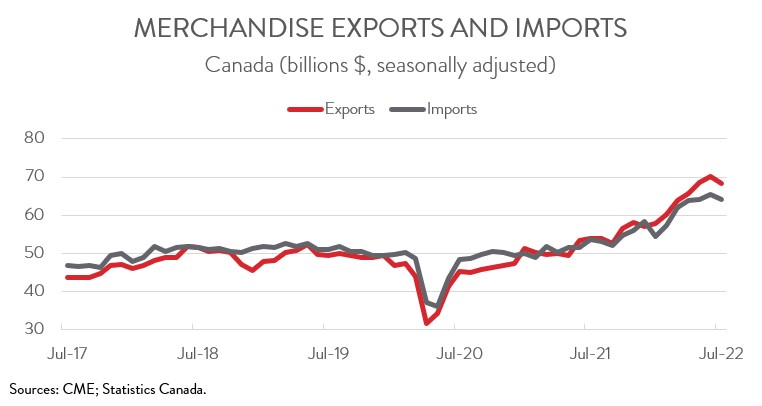
- Merchandise exports fell 2.8% to $68.3 billion in July, while merchandise imports declined 1.8% to $64.2 billion.
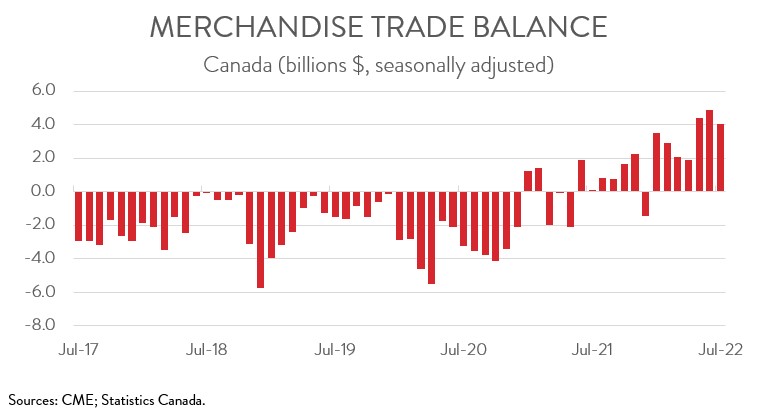
- Canada’s merchandise trade surplus narrowed from $4.9 billion in June to $4.1 billion in July.
- After removing price effects, export volumes were up 1.7% but import volumes were down 1.4%.
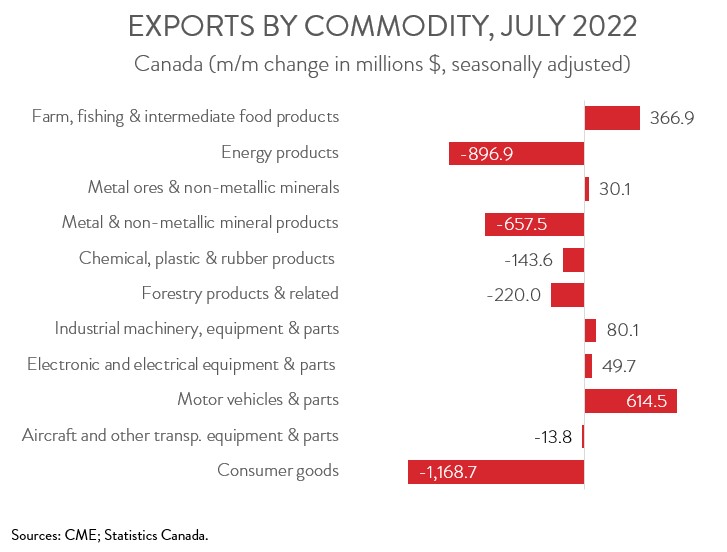
- The decrease in nominal exports spanned 6 of 11 major commodity groups, led by lower exports of consumer goods, energy products, and metal and non-metallic mineral products.
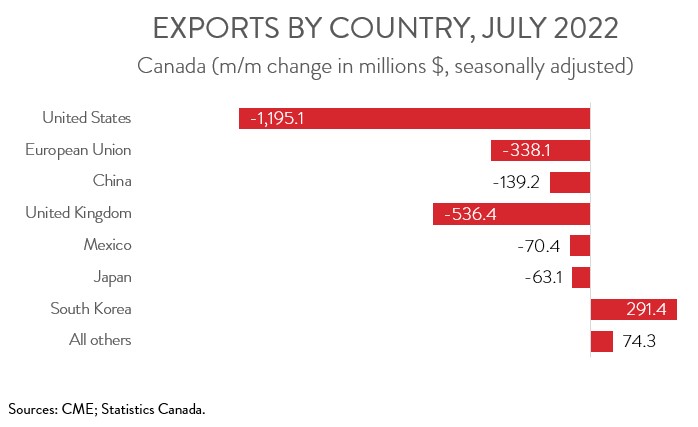
- Exports to the U.S. fell 2.2% to $52.7 billion in July, while exports to the rest of the world decreased 4.8% to $15.5 billion.
- This year’s impressive export growth performance and large trade surpluses have been largely driven by higher commodity prices. However, Canada’s trade surplus narrowed in July in the wake of declines in prices for both oil and natural gas. With oil prices remaining on a downward trend in August and early September, the trade surplus will likely narrow further.
EXPORTS AND IMPORTS BOTH DOWN IN JULY
Canadian merchandise exports fell 2.8% to $68.3 billion in July, the first monthly decline this year. At the same time, merchandise imports slumped 1.8% to $64.2 billion, down for the first time since January. The decline in nominal exports was entirely driven by a sharp decrease in prices, as export volumes were actually up 1.7%. In contrast, import volumes decreased 1.4% in July.

This year’s impressive export growth performance and large trade surpluses have been largely driven by higher commodity prices. However, Canada’s trade surplus narrowed in July in the wake of declines in prices for both oil and natural gas. With oil prices remaining on a downward trend in August and early September, the trade surplus will likely narrow further. At the same time, Canada’s export activity is expected to moderate over the near term as global demand weakens.
CANADA’S TRADE SURPLUS SHRINKS
Canada’s merchandise trade surplus narrowed from $4.9 billion in June to $4.1 billion in July. Breaking these data down, our trade surplus with the U.S. narrowed from $13.3 billion in June to $11.8 billion in July. At the same time, our trade deficit with the rest of the world narrowed from $8.4 billion to $7.8 billion, the lowest recorded deficit since January.

EXPORTS OF CONSUMER GOODS DECLINE THE MOST
The decrease in exports spanned 6 of 11 product categories. Exports of consumer goods declined the most, falling 14.3% to $7.0 billion. The decrease was attributable to a steep drop in exports of pharmaceutical products, which returned to more normal levels after rising sharply in June. Canada exported large quantities of COVID-19 medication in June, but these shipments were not repeated in July.
Exports of energy products declined 4.2% to $20.4 billion in July, the first monthly decrease of the year. The drop was fueled by a substantial decline in oil prices. In real terms, crude oil exports were up for the second consecutive month.
Also in July, exports of metal and non-metallic mineral products slumped 8.4% to $7.1 billion. The decline was largely the result of lower exports of unwrought aluminum and aluminum products, coinciding with an increase in output from China that bolstered global supplies.
On a positive note, exports of motor vehicles and parts increased 9.4% to $7.2 billion, up for the first time in three months. At the same time, exports of farm, fishing and intermediate food products rose 9.1% to $4.4 billion. The increase was mainly due to higher exports of wheat, thanks to strong global demand and improved growing conditions relative to last year.

CANADIAN EXPORTS TO THE U.S. DECREASE FOR FIRST TIME THIS YEAR
Exports to the U.S. fell 2.2% to $52.7 billion in July, the first monthly decline since December 2021. The decrease was partly the result of lower exports of crude oil and pharmaceutical products. At the same time, exports to the rest of the world dropped 4.8% to $15.5 billion. Among Canada’s major non-U.S. trading partners, exports to the U.K., the EU, China, Mexico, and Japan were down, while exports to South Korea were up. The decrease in exports to the U.K. was driven by lower exports of gold and crude oil, while the increase in exports to South Korea was propelled by crude oil, coal, and potash.
