International Trade
Merchandise Trade
August 2022
Exports Decline on Lower Energy Exports, Trade Surplus Shrinks to Lowest Level This Year
HIGHLIGHTS
- Merchandise exports fell 2.9% to $65.4 billion in August, while merchandise imports declined 1.7% to $63.9 billion.
- Canada’s merchandise trade surplus narrowed from $2.4 billion in July to $1.5 billion in August, the lowest monthly surplus this year.
- After removing price effects, export and import volumes were down 1.3% and 0.7%, respectively.
- The decrease in nominal exports spanned 7 of 11 product categories, led by a significant decline in exports of energy products.
- Exports to the U.S. fell 2.5% to $50.5 billion in August, while exports to the rest of the world decreased 4.3% to $14.9 billion.
- Today’s disappointing release was not a huge surprise given that the global economy has been slowing down and commodity prices have been moving lower. Unfortunately, manufacturing exports will be hard pressed to make gains over the near term, given the weak global economic backdrop and ongoing challenges including labour shortages and supply chain disruptions.
EXPORTS AND IMPORTS DOWN FOR SECOND STRAIGHT MONTH
Canadian merchandise exports fell 2.9% to $65.4 billion in August, while merchandise imports declined 1.7% to $63.9 billion, both down for the second month in a row. The story was also discouraging after removing price effects. In volume terms, real exports and real imports were down 1.3% and 0.7%, respectively.
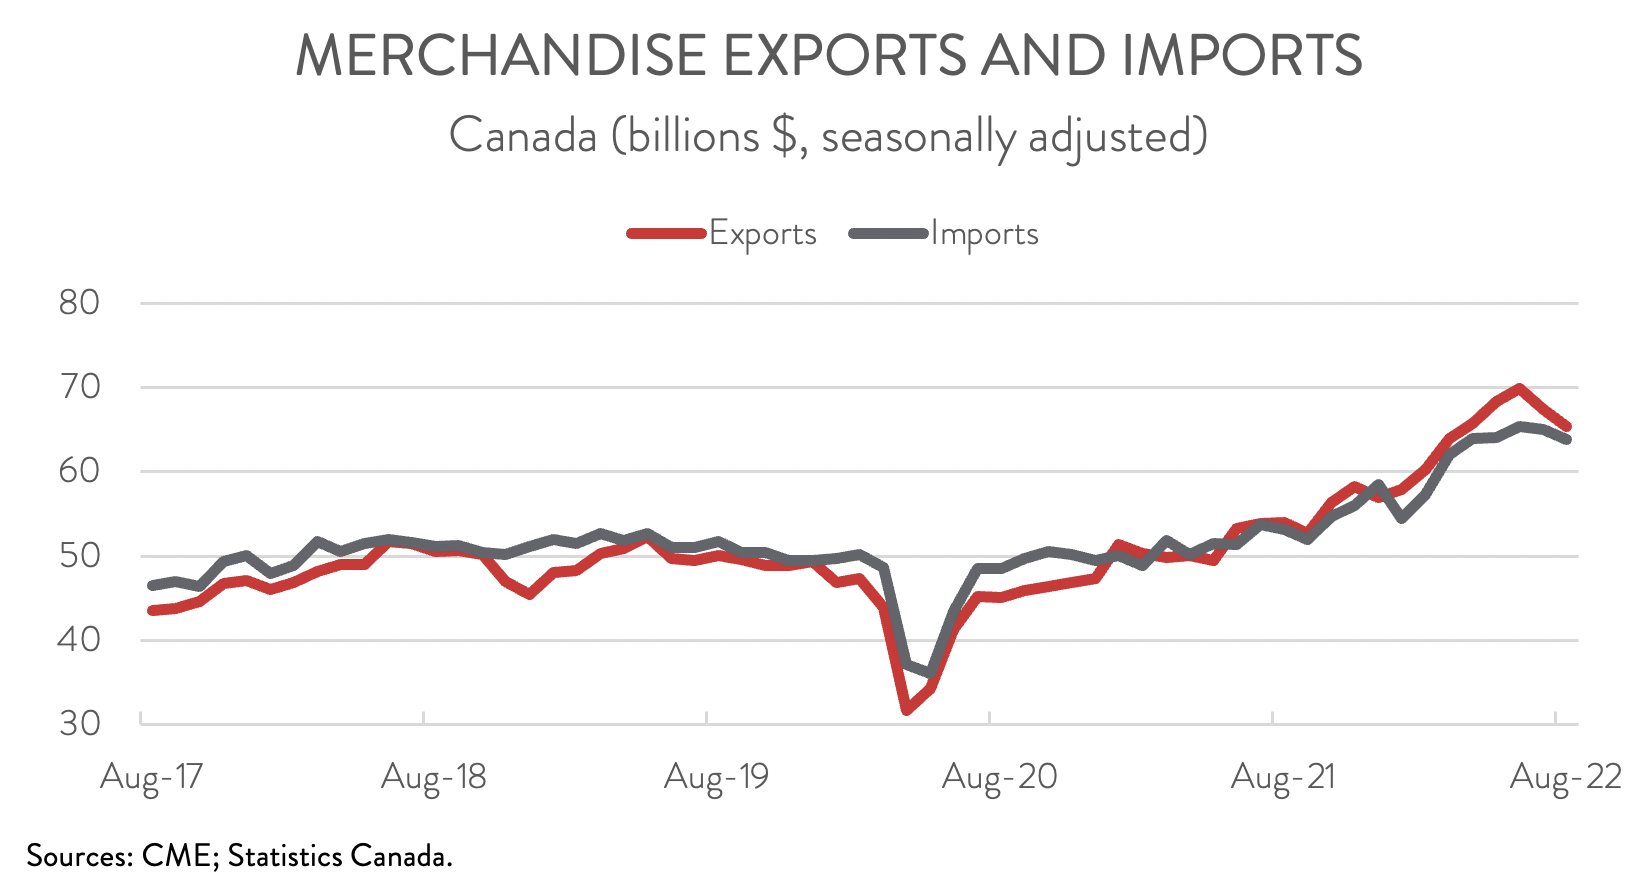
Today’s disappointing release was not a huge surprise given that the global economy has been slowing down and commodity prices have been moving lower. But with oil prices stabilizing and Canadian farmers on track to produce a better crop this year, commodity exports could see some growth over the near term. On the other hand, manufacturing exports will struggle to make gains, given the weak global economic backdrop and ongoing challenges including labour shortages and supply chain disruptions.
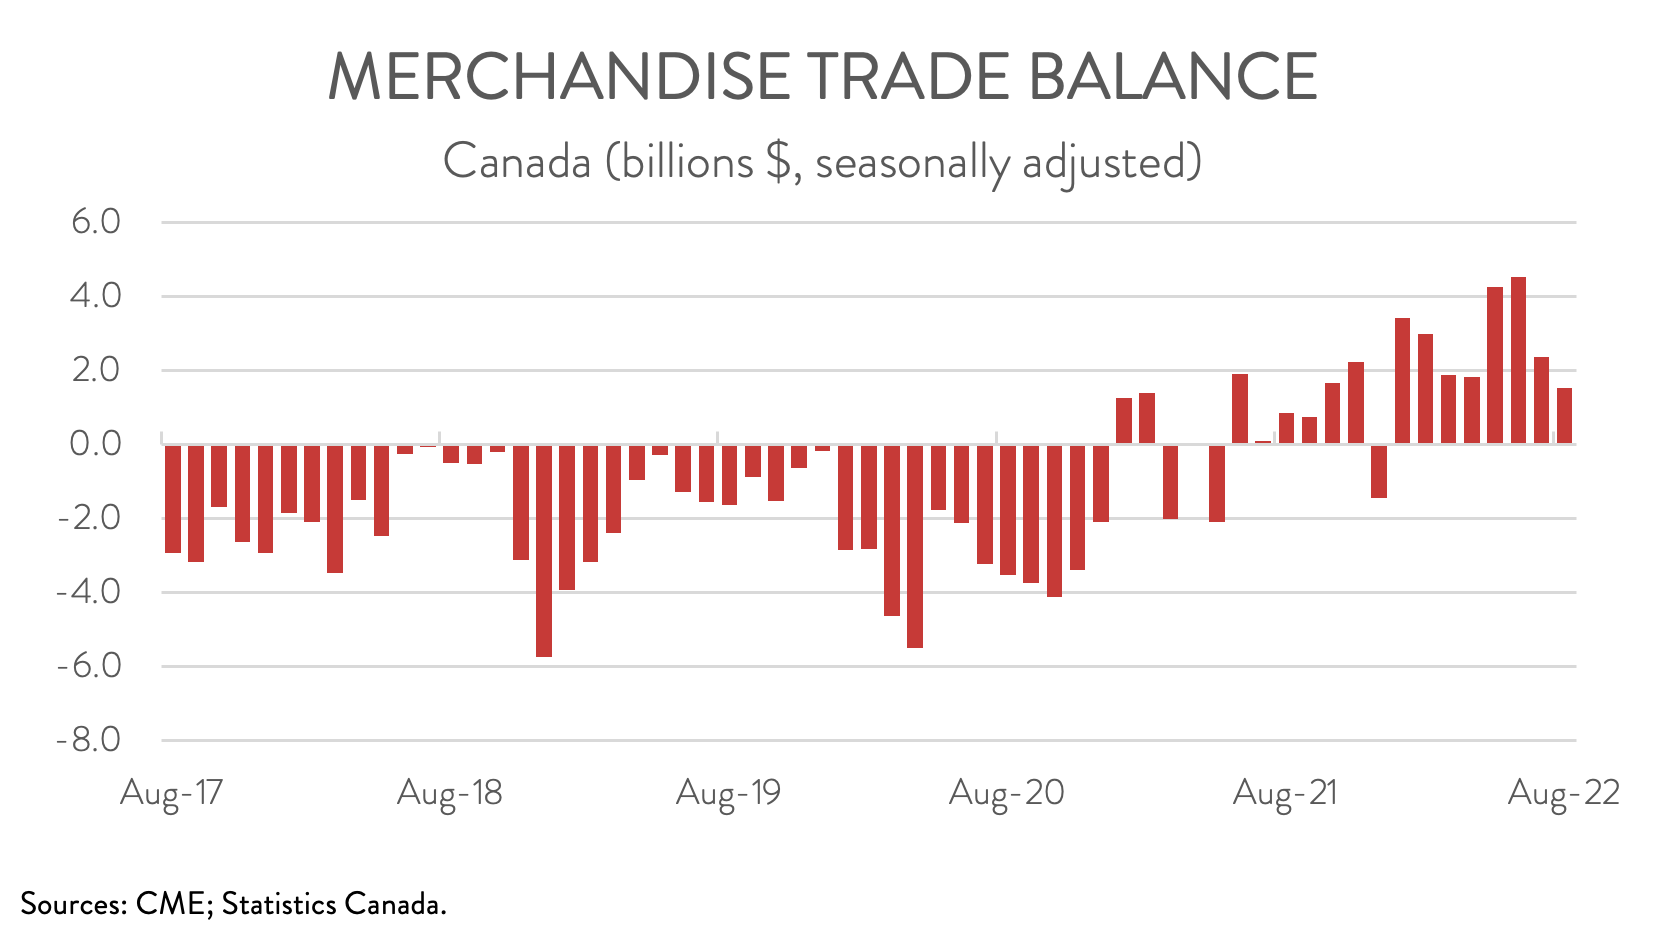
CANADA’S TRADE SURPLUS SHRINKS
Canada’s merchandise trade surplus narrowed from $2.4 billion in July to $1.5 billion in August, the lowest monthly surplus this year. Breaking these data down, our trade surplus with the U.S. remained unchanged at $10.7 billion, while our trade deficit with the rest of the world widened from $8.3 billion in July to $9.2 billion in August.
EXPORT DECLINE DRIVEN BY ENERGY PRODUCTS
The decrease in exports spanned 7 of 11 product categories. Exports of energy products fell for the second straight month, down 6.0% to $18.4 billion in August. Exports of crude oil declined the most, largely on lower prices that coincided with increased global production and heightened concerns about a global economic slowdown.
Non-energy exports also had a tough month, declining 1.7% to $47.0 billion in August. After rising 10.2% in July, exports of farm, fishing and intermediate food products decreased 7.1% to $4.1 billion in August. Wheat and canola both experienced large declines, attributable to low inventories following strong exports in prior months.
Exports of consumer goods decreased 3.7% to $6.8 billion in August, falling for the second month in a row. As was the case in July, the decline in August was driven by lower exports of gold bars to the U.S.
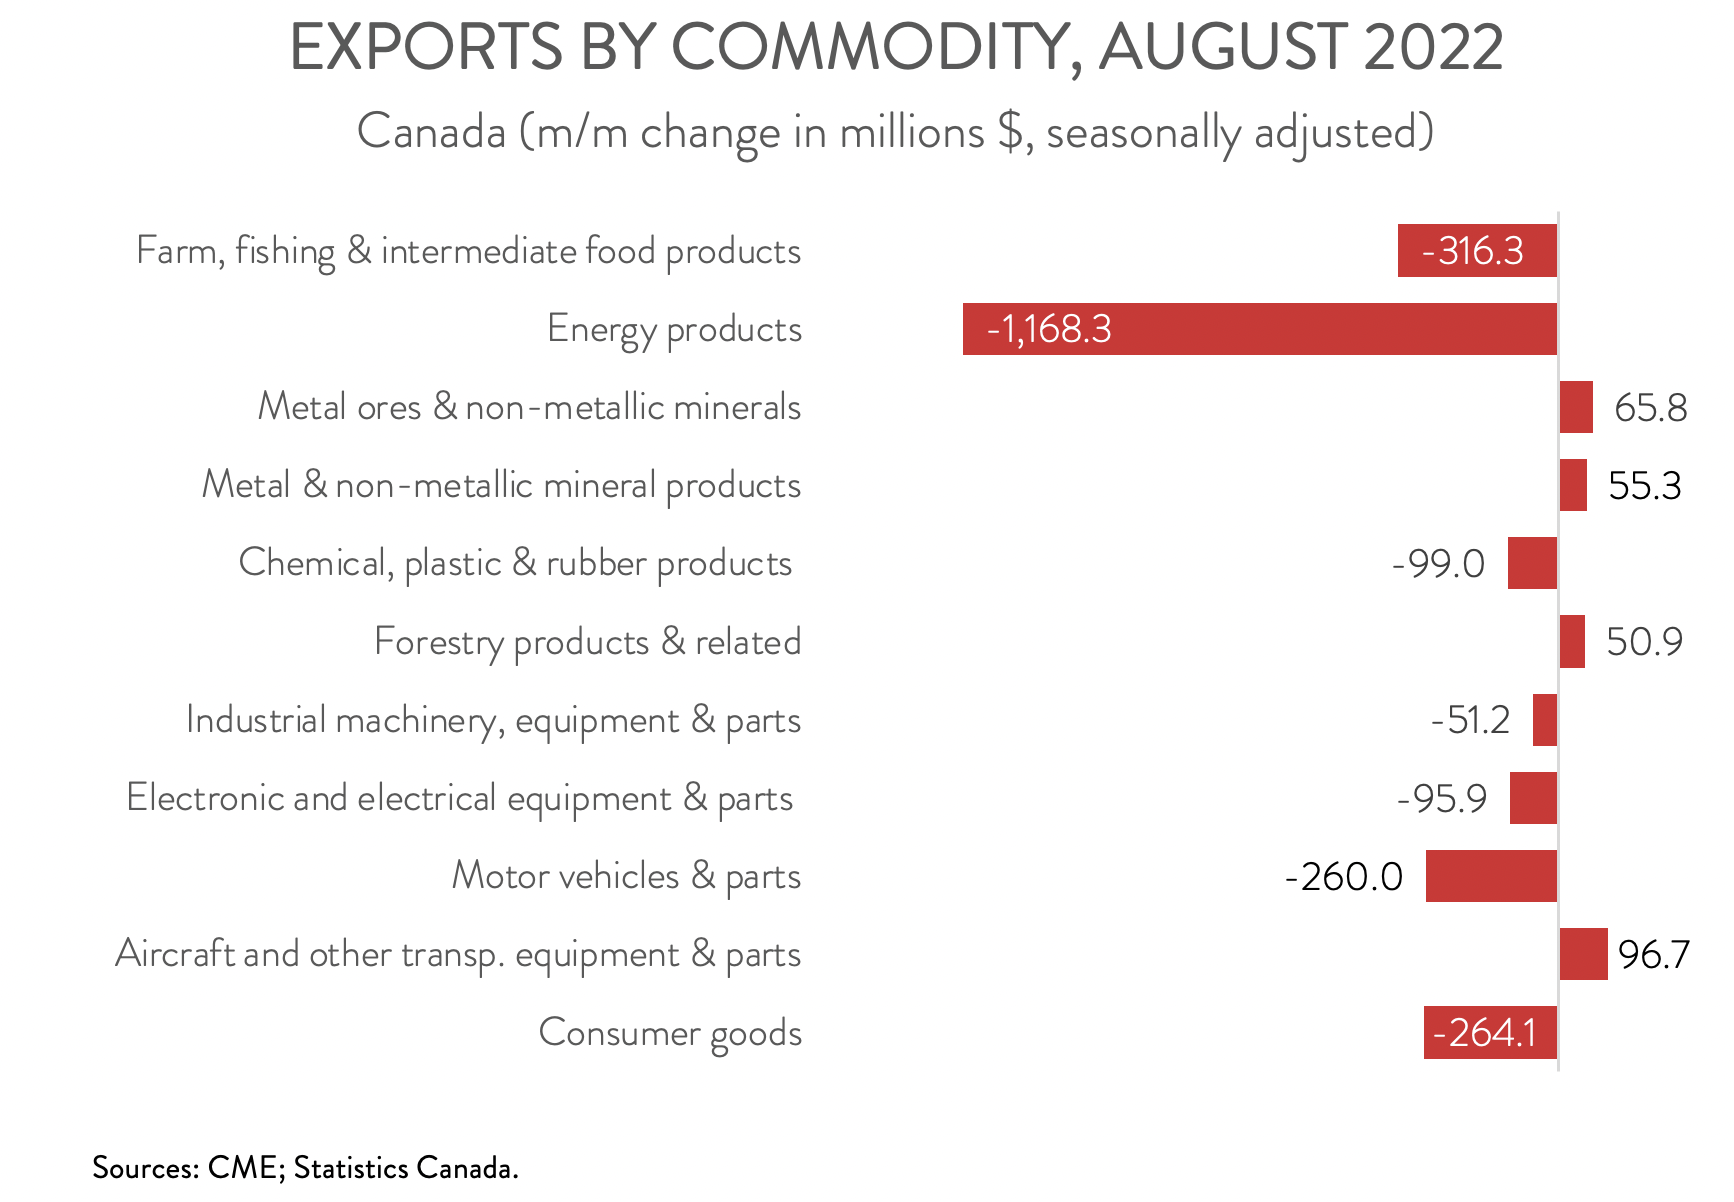
Exports of motor vehicles and parts fell 3.7% to $6.8 billion in August, down for the second time in three months, as the sector continues to feel the effects of input shortages.
While exports increased in four product categories in August, the gains were modest. Exports of aircraft and other transportation, equipment and parts grew the most, up 4.8% to $2.1 billion. This was its third increase in four months.
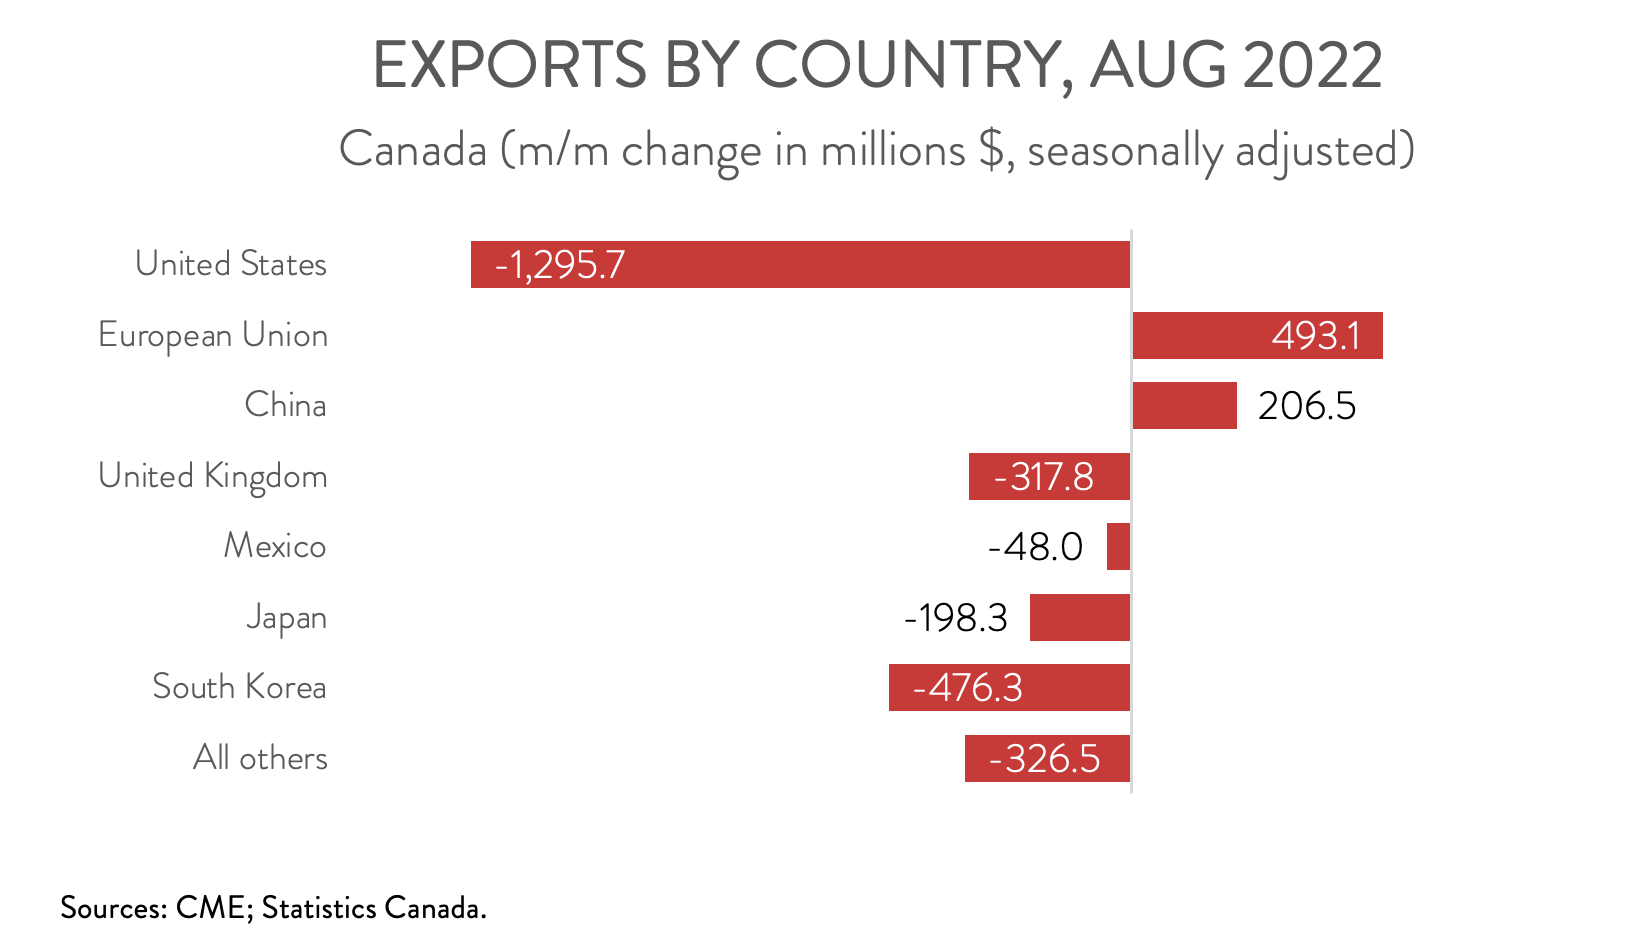
EXPORTS TO THE U.S. FALL FOR SECOND MONTH IN A ROW
Exports to the U.S. fell 2.5% to $50.5 billion in August, the second straight monthly decline following six consecutive monthly gains. The decrease was partly the result of lower crude oil exports. At the same time, exports to the rest of the world dropped 4.3% to $14.9 billion. Among Canada’s major non-U.S. trading partners, exports to South Korea, the U.K., Japan, and Mexico were down, while exports to the EU and China were up. The decrease in exports to South Korea was driven by lower exports of coal and crude oil, while the decline in exports to the U.K. was propelled by lower exports of crude oil and gold.