International Trade
International Trade
Exports flat in May on weakness in metals and auto trade.
After two months of solid growth, Canadian exports paused in May as lower deliveries of primary metals, and autos and parts dampened gains elsewhere. All told, exports were effectively unchanged compared to April, coming in at about $48.3 billion for the month (April’s export numbers were revised downward from $48.6 billion to $48.4 billion).
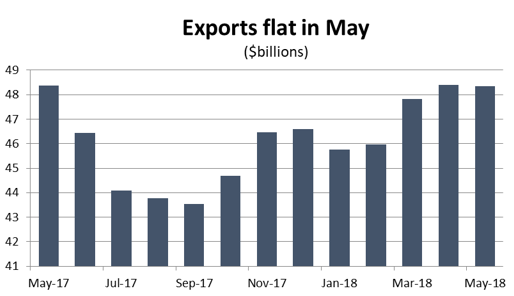
Graph showing that exports are flat in May. Merchandise Trade Analysis, May 2018.
Meanwhile, imports into Canada were up strongly, recovering from April’s decline. Imports were up 1.7 per cent to reach $51.1 billion. As a result, Canada’s monthly trade deficit expanded to about $2.8 billion in May, from about $1.9 billion the previous month.
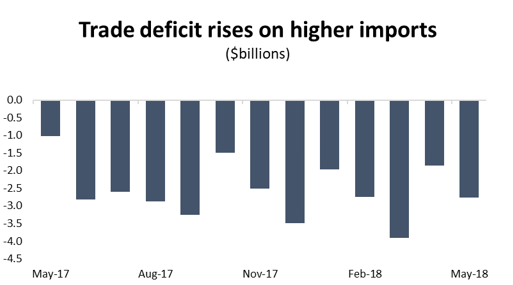
Graph showing that the trade deficit rises on higher imports. Merchandise Trade Analysis, May 2018.
Flat exports in May continue what is shaping up as a year-long trend of tepid growth. After surging ahead in early 2017, exports have levelled off and year-over-year gains have come in at less than 3.0 per cent since last July. May’s export totals are actually a hair below where they were 12 months ago. More concerning still, these trends all pre-date the rapidly-escalating trade war between Canada and the US – not to mention the US and its major trading partners around the world. There are dark clouds on the horizon for Canadian exporters and evidence about the extent of the damage should start to filter in in a month or two.
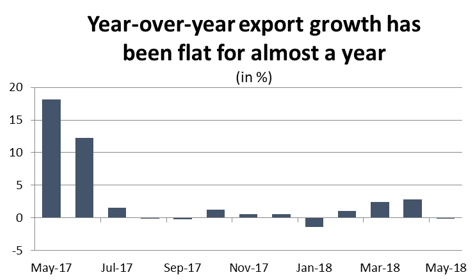
Graph showing that export growth has been flat for almost a year. Merchandise Trade Analysis, May 2018.
Export weakness in May was driven by lower sales volumes. While exporters saw average prices improve (by about 0.7 per cent), that increase was offset by a 1.0 per cent decline in sales volumes. Meanwhile, import gains into Canada were the result of a combination of higher prices and higher sales volumes; prices were 1.1 per cent higher compared to April, while import volumes were up 1.2 per cent.
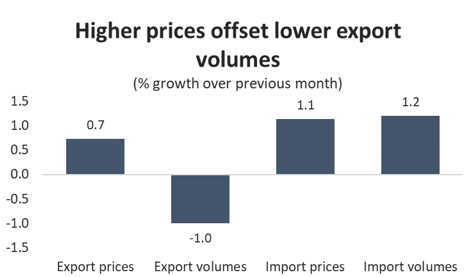
Graph showing that higher prices have offset lower export volumes. Merchandise Trade Analysis, May 2018.
In terms of export products, May’s results were mixed. Six of the 11 broad product categories posted gains, but there were larger-value losses in the other five. On the negative side, a sharp drop in iron ore exports drove a broader decline in shipments of raw metals and minerals. Exports of those products fell by 14.6 per cent ($229 million) compared to April. On a dollar-value basis there was a similar-sized decline in exports of autos and parts ($274 million). However, because the auto sector is such an important component of Canada’s export mix, that dollar figure translates into a much smaller decline on a percentage basis – 3.6 per cent. Energy exports also fell in May (1.2 per cent, or $102 million), driven down by lower deliveries of both natural gas and refined petroleum.
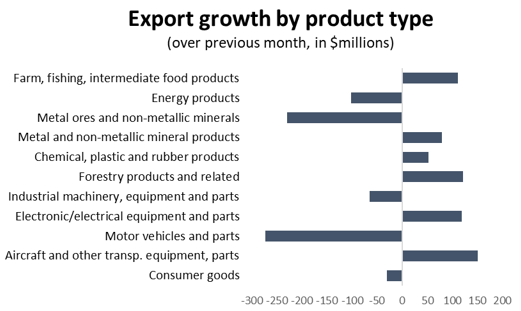
Graph showing export growth by product type. Merchandise Trade Analysis, May 2018.
On the positive side, aerospace exports – characterized by their extreme month-to-month volatility – were up by 7.8 per cent in May ($150 million). Exports of electronic/electric machinery, parts and components were also higher, as were renewable resources. Agriculture-related exports were 4.0 per cent higher in May, while exports of forestry products gained 3.1 per cent.
In terms of export destinations, Canada improved its penetration of several smaller markets in May, while deliveries to many of its more traditional trade partners were down. The largest increase in exports was to Saudi Arabia, where deliveries jumped nearly 28 per cent ($314 million). There were also sizable gains in trade with Hong Kong ($227 million), Japan ($182 million) and Brazil ($115 million).
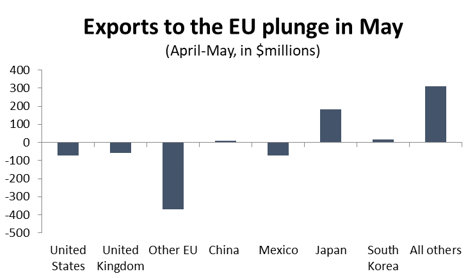
Graph demonstrating the plunge in exports to the EU in May. Merchandise Trade Analysis, May 2018.
At the other end of the spectrum, exports to the US and Europe were down in May. US-bound exports fell by just 0.2 per cent, but that translates into a dollar-value decline of about $72 million. More dramatically, Canadian exports to the EU plunged in May, falling by $427 million. The decline was concentrated in France and the Netherlands.
On the import side, the 1.7 per cent increase was the mirror image of April – gains in eight of the 11 major product categories. On a percentage basis, by far the largest increase was in imports of aircraft and parts, which jumped 17.7 per cent. There was also a recovery in imports of raw metals and minerals (7.7 per cent), as well as another increase in energy imports (4.4 per cent). The only product categories to see imports fall in May were agriculture-related goods, metal and mineral products, and motor vehicles and parts.
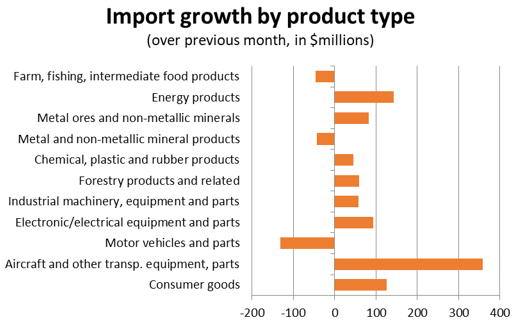
Chart showing import growth by product type. Merchandise Trade Analysis, May 2018.
After falling in April, imports from China and the US both recovered in May. Chinese imports were up more than 10 per cent ($377 million), while those from the US were 1.0 per cent higher ($327 million). Those two countries alone accounted for more than 82 per cent of all import growth that month.
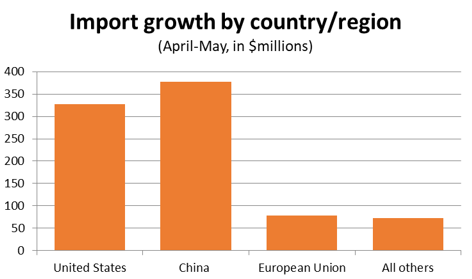
Graph showing import growth by country/region. Merchandise Trade Analysis, May 2018.