Manufacturing Sales
Manufacturing Sales
JANUARY 2022
Higher Prices Lift Factory Sales in January
HIGHLIGHTS
- Manufacturing sales increased 0.6% to $64.8 billion in January.
- The increase spanned 7 of 11 major industries, led by the petroleum and coal and wood product industries. This was partly offset by a notable decline in sales of motor vehicles and parts.
- Sales increased in five provinces in January. Quebec and BC posted the largest increases, while Ontario and Saskatchewan recorded the biggest declines.
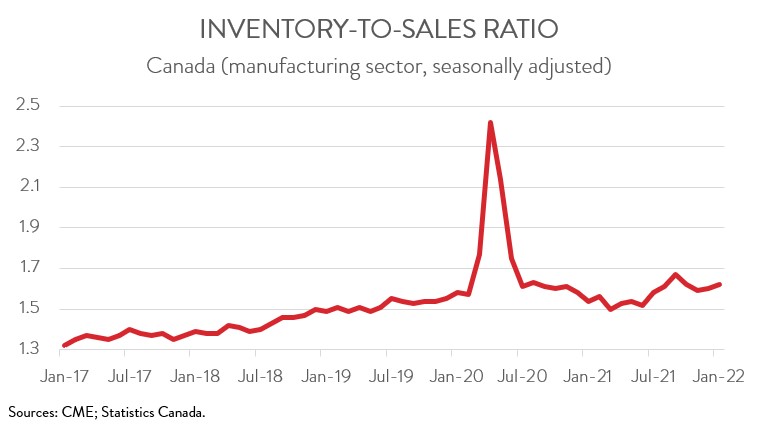
- Total inventories hit yet another all-time high, helping to push up the inventory-to-sales ratio from 1.60 in December to 1.62 in January.
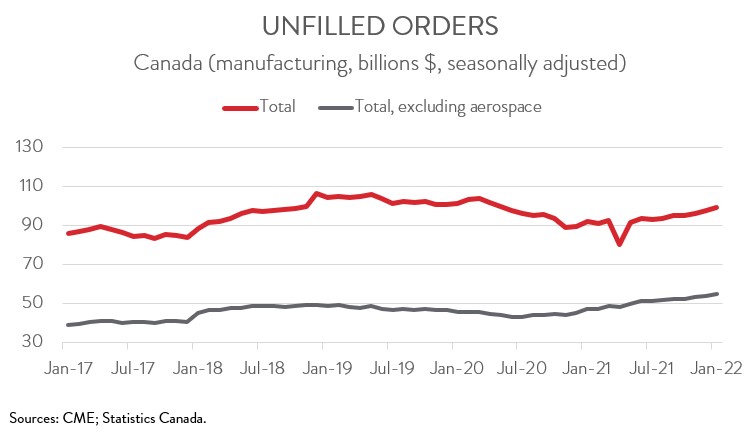
- Forward-looking indictors were positive, with unfilled orders and new orders up 1.8% and 1.1%, respectively.
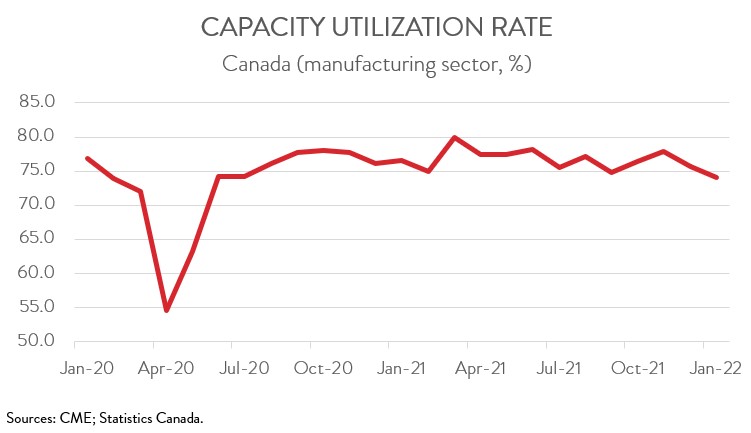
- The capacity utilization rate decreased from 75.7% in December to 74.1% in January.
- Although sales increased for the fourth straight month in January, the gains were driven by rising prices rather than growing volumes. In fact, sales in constant dollars fell 1.8%. While forward-looking indicators were positive, pointing to continued strong demand for manufactured goods, this has to be set against persistent supply disruptions and labour shortages that are hampering the ability of manufacturers to increase production.
MANUFACTURING SALES CLIMB 0.6% IN JANUARY
Manufacturing sales increased 0.6% to $64.8 billion in January. On a year-over-year basis, sales were up 13.4%.
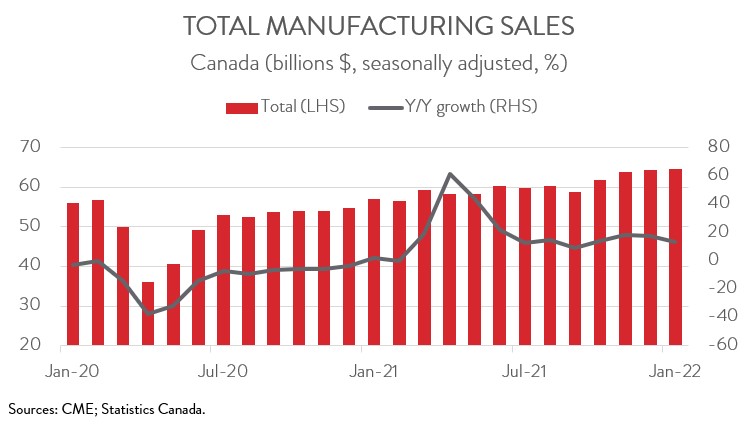
Although sales increased for the fourth straight month in January, the gains were driven by rising prices rather than growing volumes. In fact, sales in constant dollars fell 1.8%. While forward-looking indicators were positive, pointing to continued strong demand for manufactured goods, this has to be set against persistent supply disruptions and labour shortages that are hampering the ability of manufacturers to increase production.
INCREASE IN SALES LED BY PETROLEUM AND COAL AND WOOD PRODUCT INDUSTRIES
The January increase in sales spanned 7 of 11 major industries. The petroleum and coal product sector contributed the most to the growth, with sales rising 6.8% to a record high of $7.9 billion. The gain was driven primarily by higher crude oil prices, as sales in constant dollars fell 1.3%.
Higher prices, especially for softwood lumber, were also responsible for the strong increase in sales of wood products. While sales in nominal terms rose 6.5% to $4.1 billion in January, sales in real terms were flat.
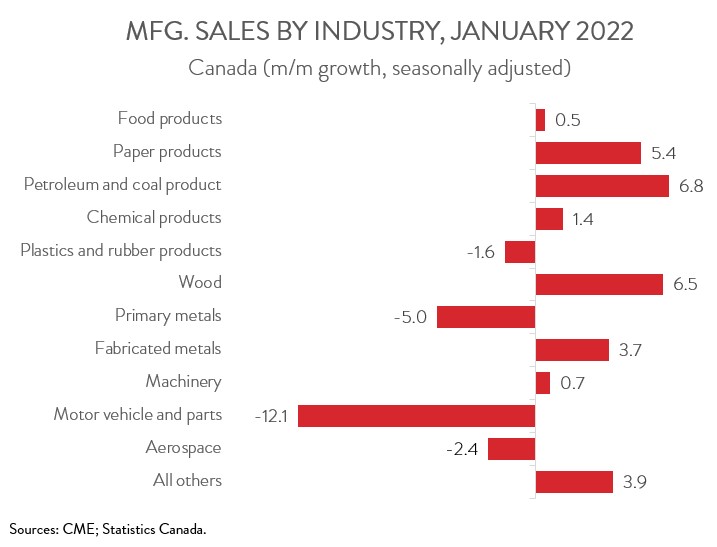
On the negative side, sales of motor vehicles and parts fell 12.1% to $5.6 billion in January, the first decline in four months. As noted by Statistics Canada, several motor vehicle assembly plants were forced to shut down production in January due to supply chain disruptions and semiconductor shortages, an issue that has plagued the industry for several months. As such, on a year-over-year basis, sales of motor vehicles and parts were down 14.5%.
Following three consecutive monthly gains, sales of primary metals fell 5.0% to $5.5 billion in January, weighed down by lower sales of non-ferrous metals (except aluminum) and iron and steel mills and ferro-alloy products. However, despite this decline, sales of primary metals were up 24.0% compared to the same month a year ago.
QUEBEC AND BC BIGGEST CONTRIBUTORS TO GROWTH IN JANUARY
Regionally, sales were up in 5 of 10 provinces in January. Quebec led the way with sales rising 3.9% to $17.0 billion, mainly on higher sales in three industries: petroleum and coal product, fabricated metal product, and transportation equipment. These gains were partly offset by lower sales of primary metals.
In BC, sales increased 4.3% to $5.5 billion in January, led by the wood and paper product industries. The wood product industry, which is the province’s largest manufacturing subsector, accounted for nearly one-quarter of total sales in January.
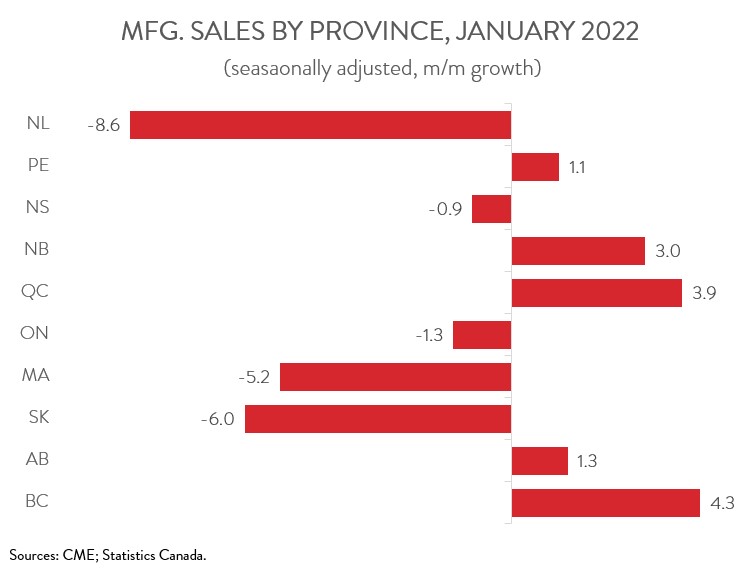
At the other end of the spectrum, sales in Ontario decreased 1.3% to $27.7 billion in January, mainly on lower sales of motor vehicles and parts and primary metal products. At the same time, sales in Saskatchewan declined 6.0% to $1.7 billion, down for the third month in a row, primarily on lower sales of chemicals.
INVENTORIES REMAIN AT RECORD-HIGH LEVELS
Total inventories increased 1.8% to a new record high of $104.9 billion in January, the thirteenth consecutive monthly increase. The gain was driven by higher inventories in the petroleum and coal product, machinery, beverage and tobacco, and fabricated metal product industries. This was mainly attributable to higher prices for raw materials.
Accordingly, the inventory-to-sales ratio rose from 1.60 in December to 1.62 in January. This ratio represents the number of months it would take to completely clear inventories assuming sales remain at their current level.
FORWARD-LOOKING INDICATORS ENCOURAGING
Forward-looking indictors were encouraging. The total value of unfilled orders rose 1.8% to $99.5 billion in January, up for the fifth time in six months. The increase was mainly attributable to higher unfilled orders of aerospace products and parts and machinery.
The total value of new orders also increased for the fifth time in six months, up 1.1% to $66.6 billion in January. The gain was driven by higher new orders of petroleum and coal products, with lower new orders of motor vehicles acting as a partial offset.
CAPACITY UTILIZATION RATE FALLS FOR SECOND STRAIGHT MONTH
Finally, the manufacturing sector’s capacity utilization rate decreased from 75.7% in December to 74.1% in January, down for the second month in a row. The decline was driven by the transportation equipment, primary metal, and non-metallic mineral product industries. This was partially offset by a ramp-up in capacity utilization in the wood product industry.