Canadian Economy
CANADIAN ECONOMY
Economy Shrinks for the First Time in Eight Months
highlights
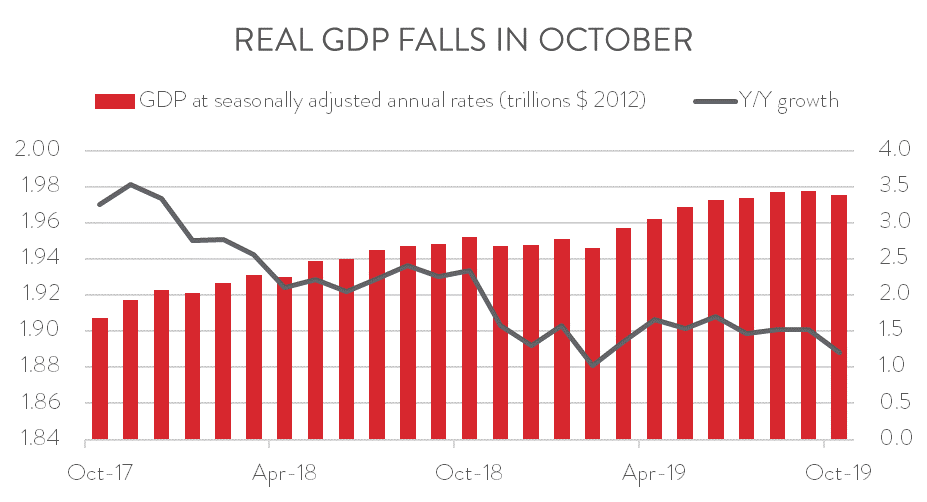
- The economy shrank 0.1 per cent in October, the first decline in eight months; year-over-year growth slowed to 1.2 per cent.
- GDP was also revised downward in prior months, meaning that momentum heading into the fourth quarter was even weaker than previously thought.
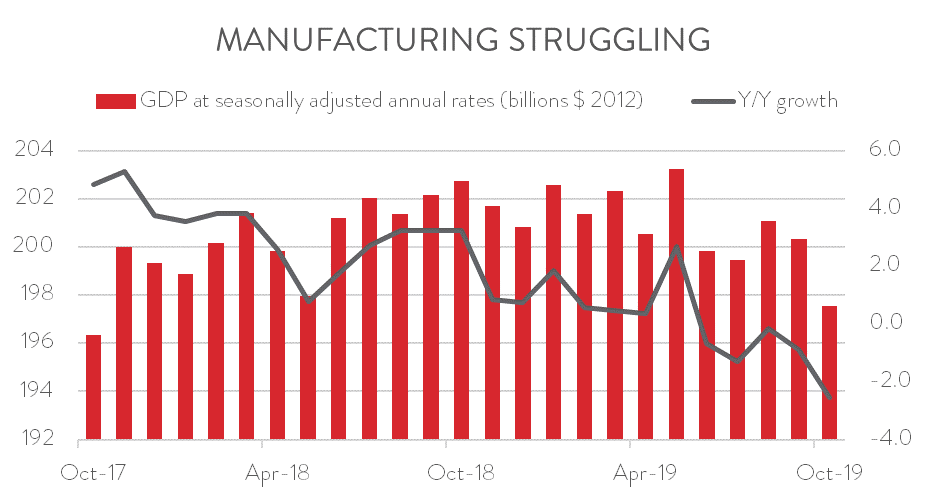
- Manufacturing output contracted by 1.4 per cent in October, the sector’s fourth decline in the last five months.
- Although the temporary disruption of the GM strike in the US was a factor behind the drop in manufacturing, several other sectors also posted declines in October.
- These figures add further evidence to the fact that Canada’s manufacturing sector is struggling, and thus reiterates the need for policy action to help manufacturers compete in globally competitive market.
GDP SHRINKS 0.1 PER CENT IN OCTOBER
Statistics Canada’s final major data release of 2019 was a disappointment, as it showed the Canadian economy shrinking by 0.1 per cent in October, the first decline in eight months. Real GDP was up only 1.2 per cent compared to October 2018, the slowest year-over-year increase since February.

To make matters worse, real GDP was also revised downward in prior months, meaning that momentum heading into the fourth quarter was even weaker than previously thought. In its October Monetary Policy Report, the Bank of Canada had predicted that the Canadian economy would expand at a 1.3 per cent annual rate in the fourth quarter. Growth is likely to fall well short of that.
GDP DECLINE CONCENTRATED IN A FEW INDUSTRIES
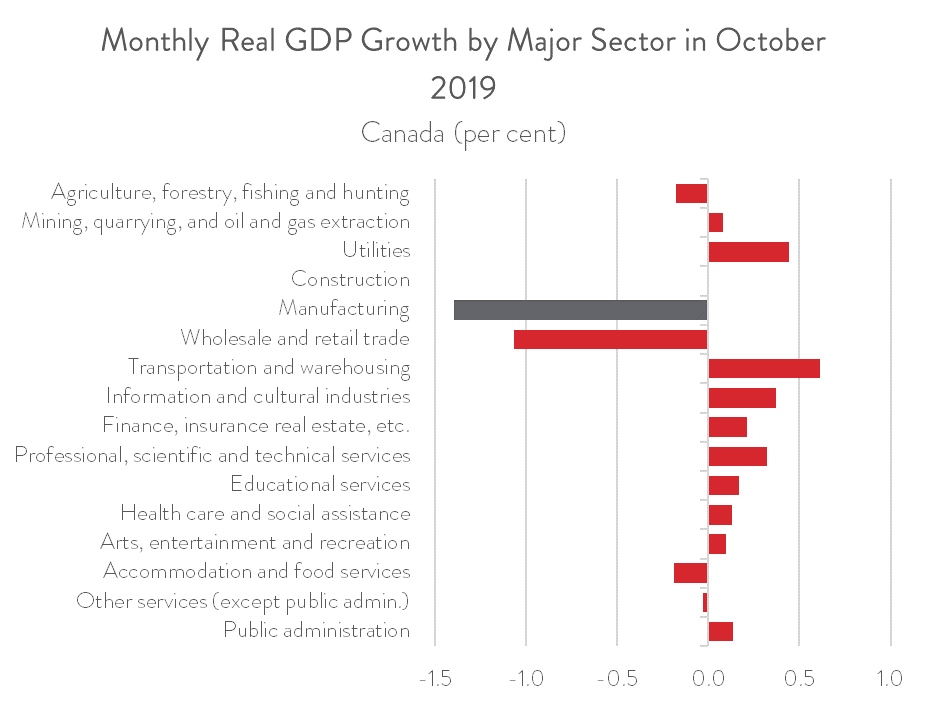
Real GDP rose in 12 of the 16 major industry groupings, led by a 0.6 per cent gain in transportation and warehousing. Solid performances were also reported in utilities, information and culture, professional services, and real estate services, the latter thanks to improving housing market activity.
But these increases were more than offset by significant declines in a few industries, most notably in manufacturing and in wholesale and retail trade. Manufacturing posted the steepest GDP loss at 1.4 per cent, followed by wholesale and retail trade output at 1.1 per cent. More modest declines were recorded in agriculture, forestry, fishing and hunting and in accommodation and food services.

MANUFACTURING OUTPUT DOWN FOURTH TIME IN FIVE MONTHS
With October’s 1.4 per cent fall, manufacturing output has now contracted in four of the last five months. As a result, output was down 2.6 per cent compared to the same month last year, the sector’s biggest year-over-year decline since January 2013. These figures add further evidence to the fact that Canada’s manufacturing sector is struggling, and thus reiterates the need for policy action to help manufacturers compete in a globally competitive market.

MOTOR VEHICLE AND PARTS PRODUCTION SIDESWIPED BY US GM STRIKE
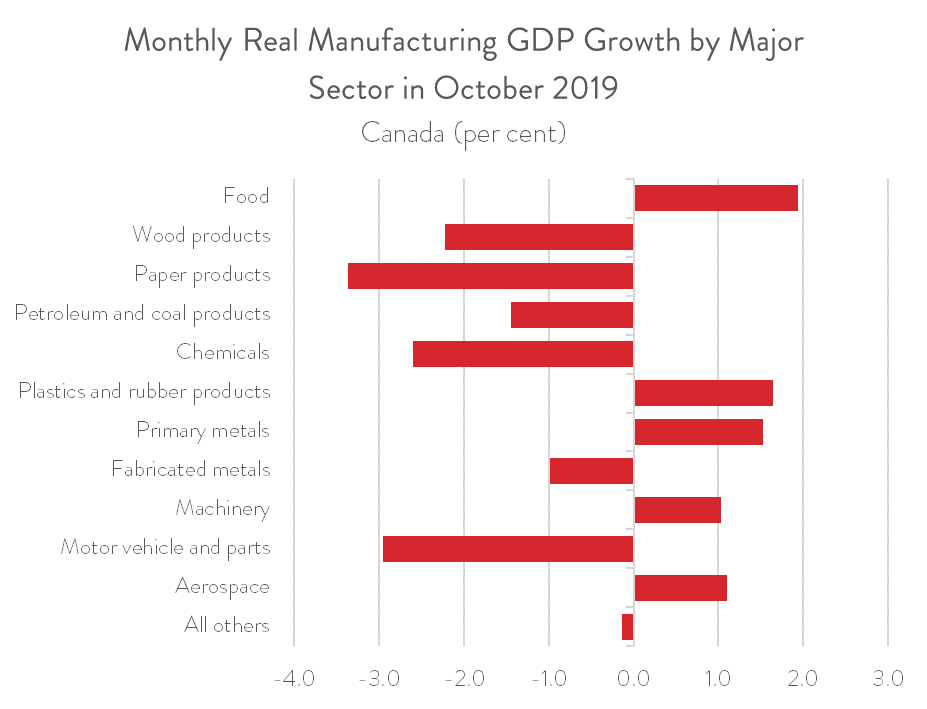
Some of the weakness displayed by the manufacturing sector in October can be pinned on temporary factors. In particular, motor vehicle and parts output tumbled by 3.0 per cent, as some Canadian plants were forced to scale back production during the General Motors strike in the United States. Expect this sector to post a rebound in November.
However, several other manufacturing subsectors also recorded declines in October, including those that fall outside the auto sector’s supply chain. In fact, output fell in 7 of 12 major sub-categories. Besides motor vehicle and parts, GDP also contracted in wood and paper products, petroleum and coal products, chemicals, and fabricated metals. These losses were partly offset by strong gains in five categories: food, plastics and rubber products, primary metals, machinery, and aerospace.

Although the auto sector led the way, manufacturing GDP growth was, in fact, quite widespread. Of the 11 major manufacturing sub-categories, eight were higher and only three, lower. On the positive side, there was strong growth in fabricated metals and wood products. On the negative side, machinery GDP fell considerably for the second month in a row, while the paper industry has seen value-added output trend downward for a full year.
All charts are sourced from CME; Statistics Canada.