Manufacturing Sales
Manufacturing Sales
May 2023
Factory Sales Rise Solidly in May, But Near-Term Outlook Remains Cloudy
HIGHLIGHTS
- Manufacturing sales rose 1.2% to $72.9 billion in May, the second increase in three months.
- Sales were up in 14 of 20 industries, with the motor vehicle and parts and chemical sectors posting the biggest gains and the primary metal industry suffering the steepest loss.
- Regionally, sales increased in 5 of 10 provinces, led by Ontario and Alberta.
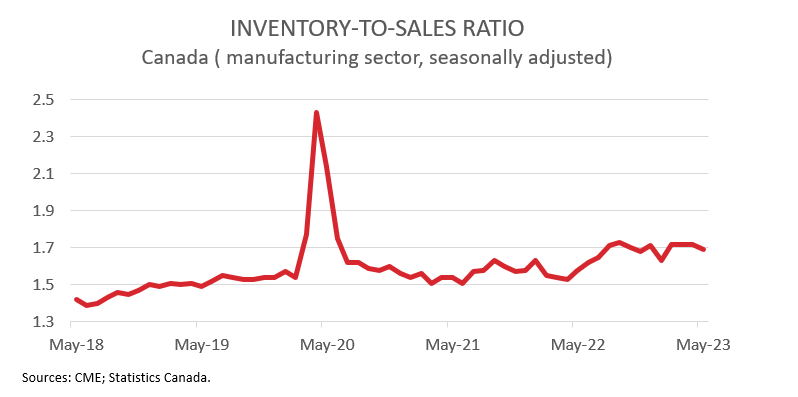
- The inventory-to-sales ratio decreased from 1.72 in April to 1.69 in May.
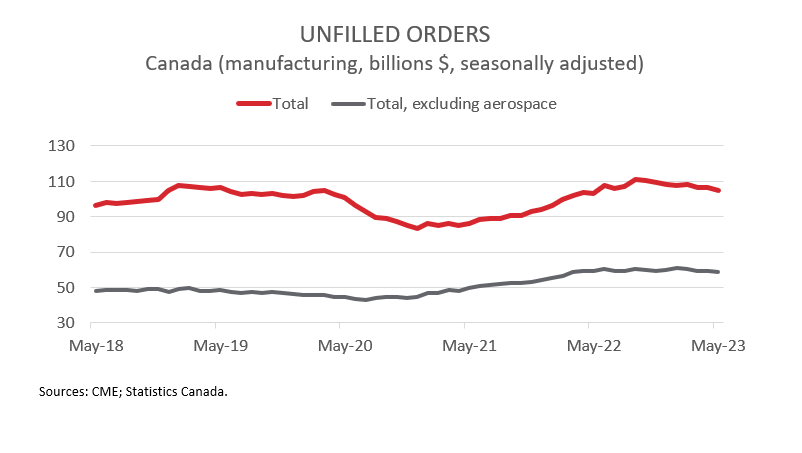
- Forward-looking indictors were discouraging, with unfilled orders and new orders down 1.5% and 1.3%, respectively.
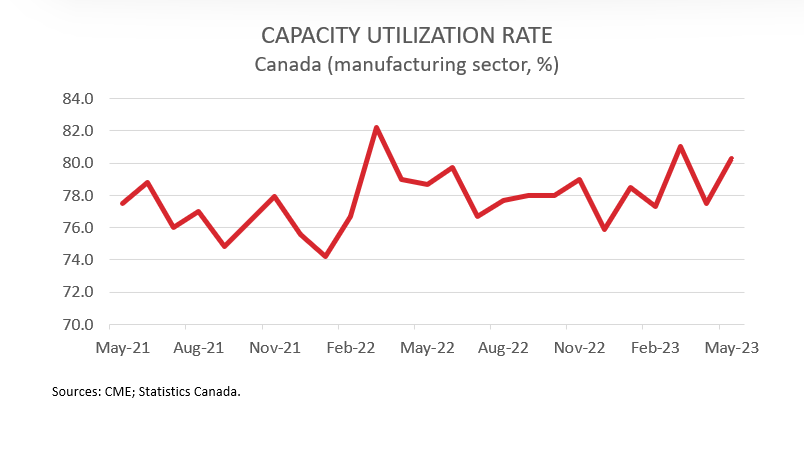
- The manufacturing sector’s capacity utilization rate increased from 77.5% in April to 80.3% in May.
- Despite the solid monthly gain, manufacturing sales in May were up only a modest 0.2% compared to a year ago. Consistent with negative forward-looking indicators, the near-term outlook for Canada’s manufacturing sector remains cloudy, with sharply higher interest rates continuing to drag down global economic growth.
MANUFACTURING SALES UP 1.2% IN MAY ON HIGHER VOLUMES
Manufacturing sales rose 1.2% to $72.9 billion in May, the second increase in three months. Sales in constant dollars climbed an even faster 2.2%, indicating that the increase in sales was driven by higher volumes.
Despite the big monthly gain, manufacturing sales in May were up only a modest 0.2% compared to a year ago. Consistent with negative forward-looking indicators, the near-term outlook for Canada’s manufacturing sector remains cloudy, with sharply higher interest rates continuing to drag down global economic growth.
GAINS DRIVEN BY THE MOTOR VEHICLE AND PARTS AND CHEMICAL SECTORS
The increase in May was broad-based, spanning 14 of 20 industries. Sales in the motor vehicle and parts sector rose 8.1% to $8.8 billion in May, the sixth increase in seven months and the highest level since June 2019. As noted by Statistics Canada, the number of motor vehicles manufactured and sold in Ontario has increased significantly so far in 2023, as the supply of semiconductors continues to improve.
The chemical industry also had a strong month, with sales climbing 4.8% to $5.9 billion in May. The increase was largely attributable to higher sales of pesticide, fertilizer, and other agricultural chemical products in Alberta and pharmaceutical and medicine products in Ontario.
On the negative side, sales of primary metals fell 6.9% to $5.2 billion in May, down for the third time in four months and the lowest level since June 2021. Manufacturers—especially in China—cut production amid slowing demand, resulting in lower sales in the non-ferrous metal (except aluminum) production and processing industry.
SALES UP IN FIVE PROVINCES, LED BY ONTARIO AND ALBERTA
Manufacturing sales were up in 5 of 10 provinces in May. Ontario led the way, with sales rising 3.2% to $32.9 billion. The increase was primarily driven by higher sales of chemical products and motor vehicles and parts.
In Alberta, sales increased 3.9% to $9.4 billion in May, mainly on higher sales of petroleum and coal and food products. Even though prices of refined petroleum energy products (including liquid biofuels) have been declining since the beginning of the year, the province’s sales of petroleum and coal products have been trending upward since March 2023, implying a big upswing in volumes.
At the other end of the spectrum, sales in Quebec fell 2.4% to $17.7 billion in May, primarily driven by lower sales of primary metals. The province’s factory sales have declined in three of the past four months and are now down 4.0% over the past year.
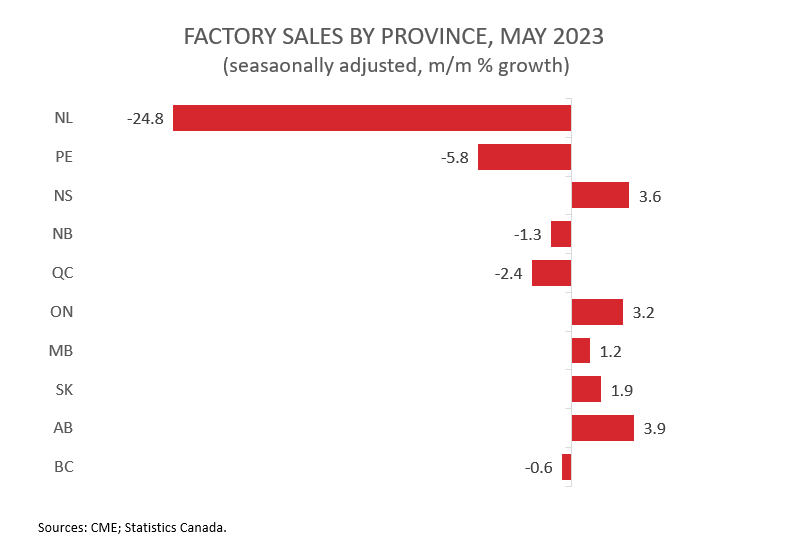
In more unwelcome news, sales in Newfoundland and Labrador plummeted 24.8% to $217.3 million in May, as a big decline in non-durable goods more than offset a solid increase on the durable goods side. To make matters worse, sales in May were nearly half of what they were last year.
INVENTORY-TO-SALES RATIO FALLS
Total inventories declined 0.6% to $122.8 billion in May, led by lower inventories in the food product, petroleum and coal product, and motor vehicle parts industries. Combined with higher sales, the inventory-to-sales ratio decreased from 1.72 in April to 1.69 in May. This ratio represents the number of months it would take to completely clear inventories assuming sales remain at their current level.
FORWARD-LOOKING INDICATORS CONTINUE TO TREND DOWN
Forward-looking indictors were discouraging. The total value of unfilled orders declined 1.5% to $105.0 billion in May, down for the sixth time in eight months. The aerospace product and parts industry contributed the most to the decline. It was a similar story for new orders; they fell 1.3% to $71.2 billion in May, also down for the sixth time in eight months.
CAPACITY UTILIZATION RATE RISES
Finally, the manufacturing sector’s capacity utilization rate increased from 77.5% in April to 80.3% in May. The most notable gains were observed in the transportation equipment, non-metallic mineral product, and chemical sectors.