Manufacturing Sales
Manufacturing Sales
July 2023
Factory Sales Increase in July, Despite Disruptions Caused by BC Port Strike
HIGHLIGHTS
- Following a decline of 2.0% in June, manufacturing sales rose 1.6% to $71.9 billion in July.
- The gains in July would have been even stronger were it not for the disruptions caused by the BC port strike.
- The increase in sales spanned 12 of 20 subsectors, led by the food, petroleum and coal product, and motor vehicle and parts industries.
- Regionally, sales were up in 7 of 10 provinces, with Quebec and Saskatchewan posting the biggest gains and Manitoba experiencing the steepest loss.
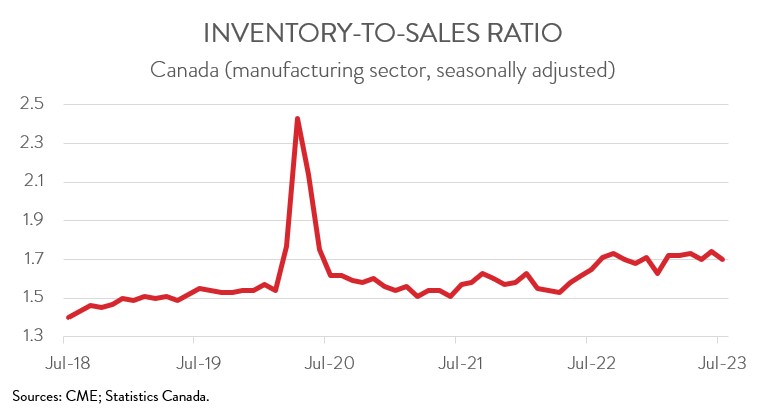
- The inventory-to-sales ratio decreased from 1.74 in June to 1.70 in July.
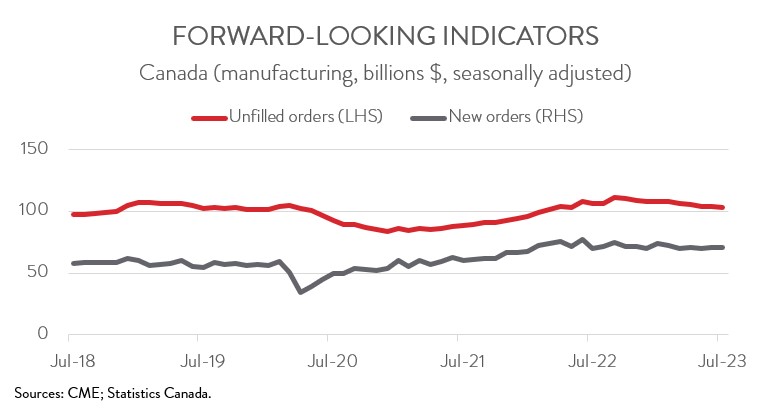
- Forward-looking indictors were discouraging, with unfilled orders and new orders down 1.0% and 0.1%, respectively.
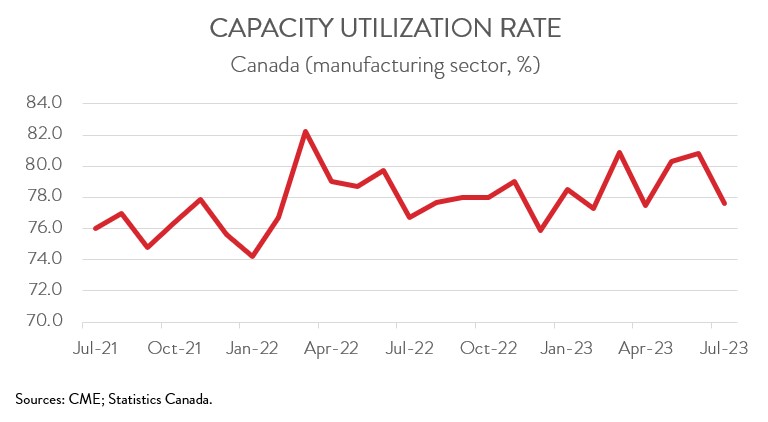
- The manufacturing sector’s capacity utilization rate decreased from 80.8% in June to 77.6% in July.
- Even with the increase in July, factory sales have experienced no growth over the last 12 months, held back by higher interest rates and a slowing global economy.
MANUFACTURING SALES UP 1.6% IN JULY
Following a decline of 2.0% in June, manufacturing sales rose 1.6% to $71.9 billion in July. Sales in constant dollars were up 0.9%, indicating that a higher volume of goods was sold.
The gains in July would have been even stronger were it not for the disruptions caused by the BC port strike. According to Statistics Canada, the strike affected 13.2% of factories in July, mainly through raw material shortages and transportation disruptions. Data indicate that the paper and chemical subsectors were the most acutely affected by the strike.
Even with the increase in July, factory sales have experienced no growth over the last 12 months, held back by higher interest rates and a slowing global economy.
TWELVE SUBSECTORS POST GROWTH
The increase in July spanned 12 of 20 industries. Food manufacturing led the way, with sales increasing 3.1% to $12.4 billion, the first gain in six months. The monthly increase was attributable to significant gains in the grain and oilseed milling industry, partially due to resumption of operations following maintenance shutdowns at some crushing plants in June.
Sales of petroleum and coal products rose 4.6% to $7.5 billion in July, following a 9.9% decline in June. The increase was largely driven by higher prices, though volumes were also up 0.8%. Even with the rebound in July, however, petroleum and coal product sales were down 26.7% year-over-year.
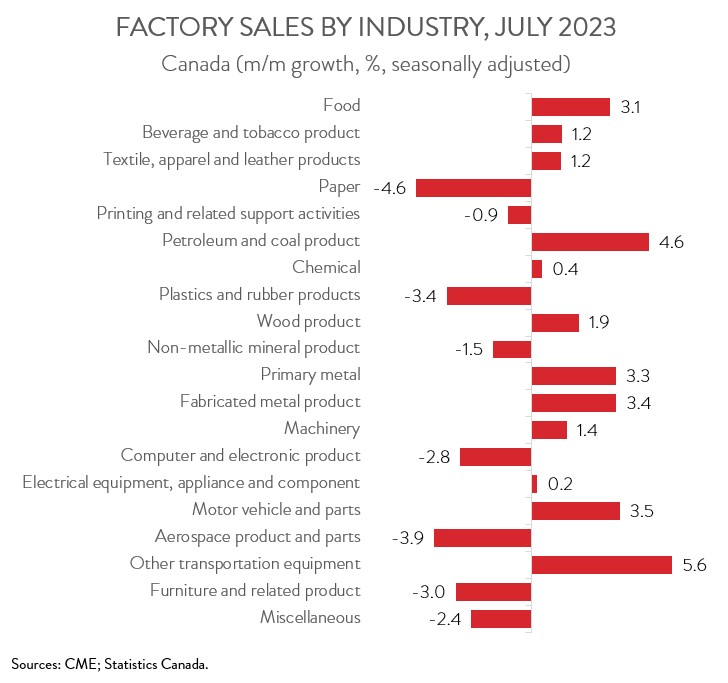
The auto sector’s impressive recovery remained on track in July, as the continued easing of global supply chain pressures has enabled auto manufacturers to produce and sell more vehicles. In fact, sales of motor vehicles and parts rose 3.5% to $9.6 billion in July, the highest level since January 2016. Year-over-year, sales were up 37.4%.
On the downside, sales of paper products declined 4.6% to $2.6 billion in July, the lowest level since December 2021. More than half of paper product manufacturers in BC were affected by the port strike, largely explaining the sizeable monthly decline.
In addition, sales in the plastics and rubber products industry fell 3.4% to $3.3 billion in July, the second consecutive monthly decline. The last 12 months have not been kind to this subsector, with sales down 8.2% year-over-year.
QUEBEC AND SASKATCHEWAN LEAD PROVINICAL GAINS
Manufacturing sales were up in 7 of 10 provinces in July. Quebec contributed the most to the national increase, with sales up 3.5% to $17.9 billion in July. The gain was largely driven by higher sales of primary metals.
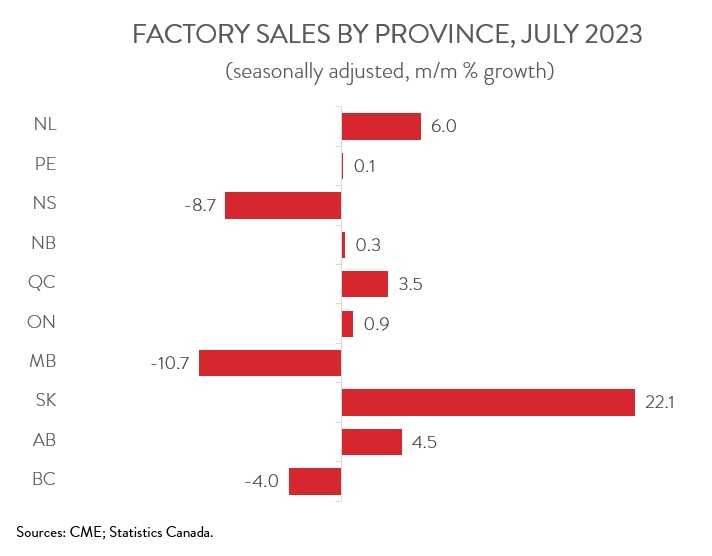
Sales in Saskatchewan surged 22.1% to $2.1 billion in July, largely offsetting the substantial decline seen in June. The rebound was mainly driven by higher sales of grain and oilseed milling products after some oilseed manufacturers experienced downtime in June.
At the other end of the spectrum, sales in Manitoba posted the steepest decline in July, down 10.7% to $2.0 billion, the lowest level since April 2022. The decline was partly attributable to lower sales of motor vehicles and aerospace products and parts.
INVENTORY-TO-SALES RATIO DECLINES
Total inventories decreased 0.7% to $122.4 billion in July, with lower inventories of chemicals contributing the most to the decline. This, combined with the increase in sales, drove down the inventory-to-sales ratio from 1.74 in June to 1.70 in July. This ratio represents the number of months it would take to completely clear inventories assuming sales remain at their current level.
FORWARD-LOOKING INDICATORS DISCOURAGING
Forward-looking indictors were discouraging. The total value of unfilled orders fell 1.0% to $103.3 billion in July, the fourth decline in five months. The decrease in July was primarily driven by lower unfilled orders of computer and electronic products and aerospace products and parts. At the same time, new orders edged down 0.1% to $70.8 billion in July, the fourth decrease in six months.
CAPACITY UTILIZATION RATE DECREASES
Despite the increase in sales, the manufacturing sector’s capacity utilization rate fell from 80.8% in June to 77.6% in July. The most notable declines were observed in the wood product, transportation equipment, and machinery subsectors.