International Trade
Merchandise Trade
February 2023
Canada’s Trade Surplus Narrows in February, as Exports and Imports Fall
HIGHLIGHTS
- Following strong gains in January, Canadian merchandise exports fell 2.4% to $65.0 billion in February, while merchandise imports decreased 1.3% to $64.6 billion.
- Canada’s merchandise trade surplus narrowed from $1.2 billion in January to $422 million in February.
- After removing price effects, export volumes and import volumes were down 0.9% and 0.8%, respectively.
- The decline in exports was widespread, with all product sections decreasing except farm, fishing and intermediate food products.
- Exports to the U.S. contracted 0.9% to $49.5 billion in February, while exports to the rest of the world tumbled 7.2% to $15.5 billion.
- A cooling global economy will remain a headwind for exports over the near term, though this should be somewhat offset by easing supply chain constraints and solid global demand for Canada’s natural resources.
EXPORTS AND IMPORTS BOTH DROP IN FEBRUARY
Following strong gains in January, Canadian merchandise exports fell 2.4% to $65.0 billion in February, while merchandise imports decreased 1.3% to $64.6 billion. In real or volume terms, the picture was similarly downbeat, with exports and imports down 0.9% and 0.8%, respectively.
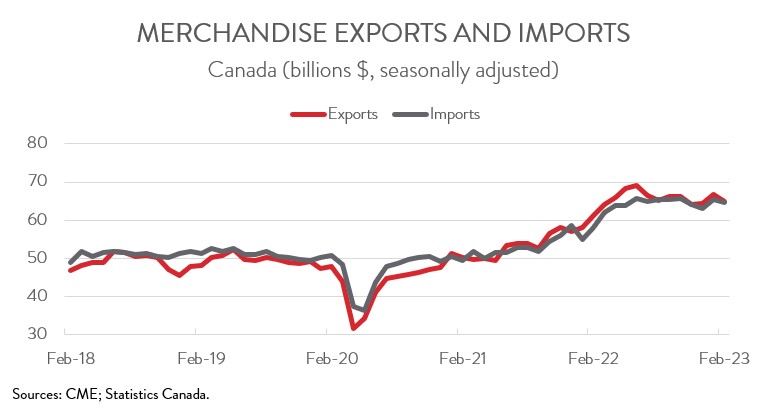
With two months in the books, it is looking likely that net trade will contribute positively to economic growth in 2023Q1, another sign that the economy rebounded in the first quarter after posting no growth in 2022Q4. Still, a cooling global economy will remain a headwind for exports over the near term, though this should be somewhat offset by easing supply chain constraints and solid global demand for Canada’s natural resources.
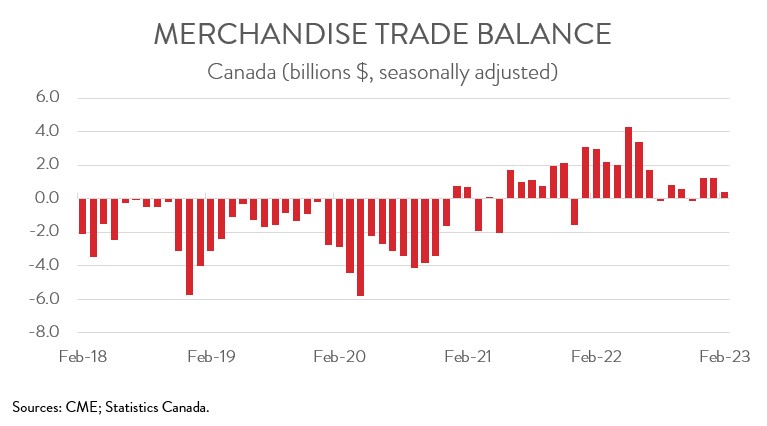
CANADA’S TRADE SUPRLUS NARROWS
Canada’s merchandise trade surplus narrowed from $1.2 billion in January to $422 million in February. Breaking the numbers down, our trade surplus with the U.S. widened from $8.6 billion in January to $9.3 billion in February, while Canada’s trade deficit with the rest of the world widened from $7.4 billion to $8.9 billion. Notably, our international merchandise trade balance has been in a surplus position in 12 of the last 14 months.
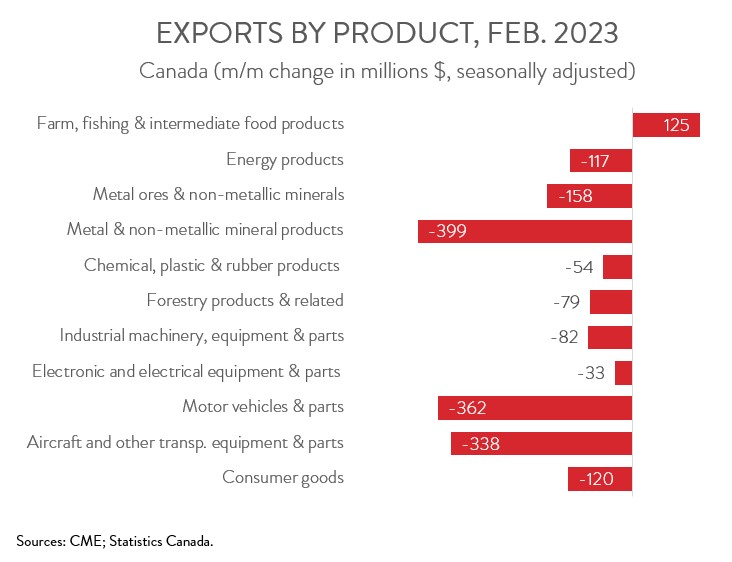
EXPORT DECLINE WIDESPREAD ACROSS PRODUCT SECTIONS
The decline in exports in February was widespread, spanning 10 of 11 major product sections. Exports of metal and non-metallic mineral products fell the most, declining 5.4% to $7.0 billion in February. The drop was mainly attributable to lower exports of refined gold to the United Kingdom and lower exports of unwrought nickel and nickel alloys to Norway.
After reaching their highest level since May 2019 in January, exports of motor vehicles and parts fell 4.4% to $7.9 billion in February 2023. Nevertheless, despite this decrease, this product section’s exports were up 28.5% on a year-over-year basis. As observed by Statistics Canada, while supply chain issues appear to be easing, they remain a significant factor in the export movements observed in recent months.
Exports of aircraft and other transportation equipment and parts tumbled 14.9% to $1.9 billion in February, their lowest level since April 2022. The decline was mainly due to lower exports of private jets and commercial aircraft.
On the positive side, exports of farm, fishing and intermediate food products rose for the fifth time in six months, up 2.1% to an all-time high of $6.0 billion in February. Exports of this product group continue to receive a lift from a bumper harvest and robust global demand.
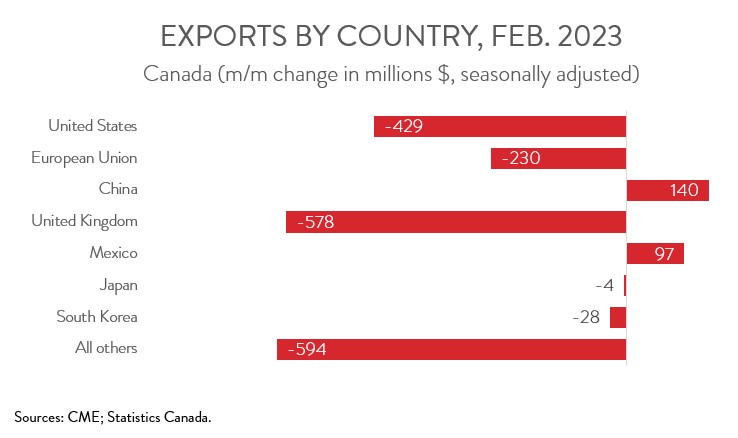
EXPORTS TO NON-US COUNTRIES TUMBLE
Exports to the U.S. decreased 0.9% to $49.5 billion in February, down for the first time in three months. At the same time, exports to the rest of the world tumbled 7.2% to $15.5 billion, more than erasing the strong gains made in January. Among Canada’s major non-U.S. trading partners, exports to the U.K, the EU, South Korea, and Japan were down, while exports to China and Mexico were up. The decrease in exports to the U.K. was driven by gold, while the increase in exports to China was fueled by agricultural products and coal.